
Site Search
Search within product
第756号 2023(R05).12発行
Click here for PDF version
§ Growth of Chinese cabbage and nitrogen application
Former Toyama Prefectural Agricultural Technology Center
松本 美枝子
§土のはなし-第27回農業と環境問題-その2
農地由来の窒素による水質汚濁
前 ジェイカムアグリ株式会社
北海道支店 技術顧問
松中 照夫
§2023 General Table of Previous Editions of this Journal
Growth of Chinese cabbage and nitrogen application
Former Toyama Prefectural Agricultural Technology Center
松本 美枝子
Introduction.
The objective of vegetable cultivation technology is to ensure a stable and abundant harvest of high quality vegetables. Here, we examined fertilization and cultivation methods for Chinese cabbage, an autumn/winter vegetable.
ハクサイはかつて一株売りが一般的であり,重くて大きいことが問題であったが,2~4分割売りが普通になった今日では,2~3kg/株程度の大株収穫が一般的になった。品質については,商品価値を著しく低下させるゴマ症の発生を回避することが問題であった。そこでこれらの問題を回避するための施肥方法を検討した。なお,ここでは,早生品種(60日タイプ)を調査用に用いた。
Growth progress of Chinese cabbage
The former synthesizes sugars and amino acids and translocates them near the stem apex (growth point), resulting in the enlargement of the tuber. Therefore, it is necessary to grow the outer leaves, which are photosynthetic organs, large enough in the early stage to maintain the photosynthetic function until harvest. In other words, the fertilizer application method should focus on basal fertilizer, but it is important to ensure that fertilizer does not run out until the time of harvest.
In Figure 1, leaf position is shown as logarithmic, with the leaf that initiates tuberization as 1.
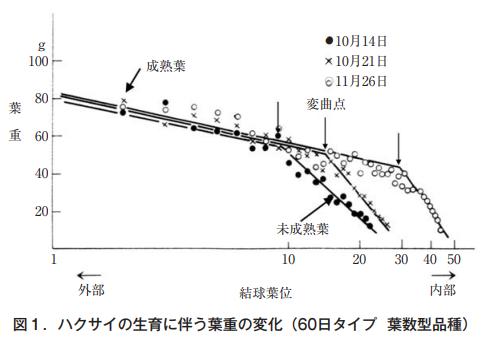
分化し始めの葉は,その後徐々に大きくなり(未成熟葉),大きさが一定になる(成熟葉)。未成熟葉から成熟葉に変化する葉位を変曲点とし,↓で示した。なお,結球葉は3/5葉序で回転し,徐々に大きくなる。
If the plot of leaf weight deviates from the "straight line showing the relationship between leaf position and leaf weight (Figure 1)" for mature leaves, the nitrogen supply at the time of leaf maturity is insufficient, and if it deviates above the straight line, the nitrogen supply was excessive. If these changes in leaf weight are observed, the amount and timing of basal and supplemental fertilizer should be adjusted.
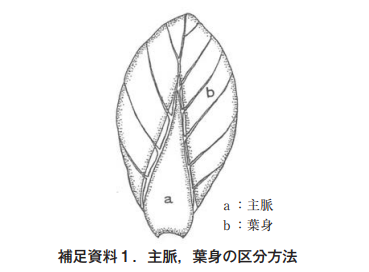
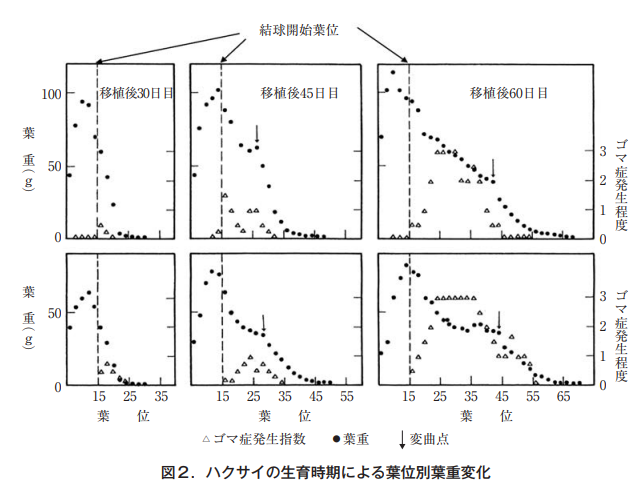
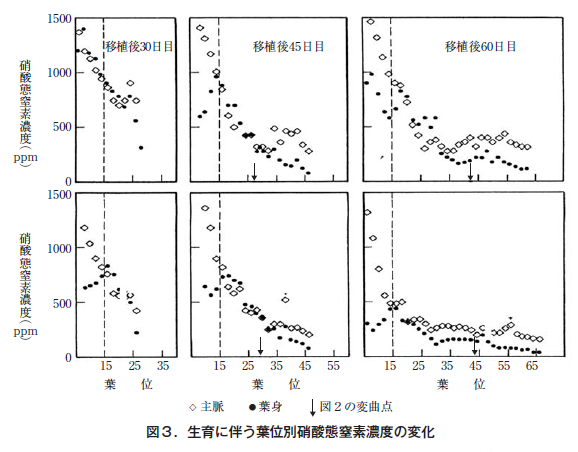
次に,葉位の対数表示を解除して,定植30日,45日,60日目の葉重とゴマ症発生程度を図2に示した。また,同一試料を用い,主脈と葉身に分けて,それぞれの硝酸態窒素濃度を図3に示した(補足資料1)。
Here, sesamoidosis newly occurring on immature leaves was defined as a type 1 outbreak, while sesamoidosis with reemerging outbreaks on mature leaves was defined as a type 2 outbreak.
In Figures 2 and 3, leaf position is indicated as an integer. In Figures 2 and 3, the relationship between leaf position and leaf weight is shown as an inflection point ↓, as in Figure 1, because differences were observed in the relationship between mature and immature leaves.
Leaf weight and degree of sesamosis incidence were examined on two plants each at 30, 45, and 60 days after planting (Figure 2). At 60 days after planting, the incidence of sesamosis increased significantly at leaf positions 25 to 45 (type 2). This type 2 sesamosis occurred at the inner leaf level below the inflection point.
In Figure 3, nitrate nitrogen concentrations in the main veins and leaf blades were investigated using the material in Figure 2. In all the sections, the concentration in the main vein was higher than that in the leaf blade, and a concentration peak was observed in the main vein about 10 leaves inside from the inflection point, which almost coincided with the initiation site of type 1 development. It was thought that nitrate-nitrogen was supplied simultaneously with water to the immature leaves as they grew larger, and that this was related to the occurrence of type 1 sesame seed disease.
Scene at the time of harvesting Chinese cabbage.
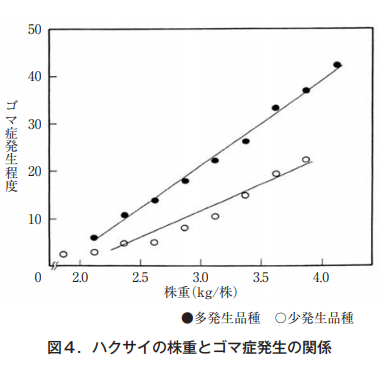
いずれの品種も大株ほどゴマ症の発生は多いが,こうした傾向は,多発生品種でより顕著であった(図4)。
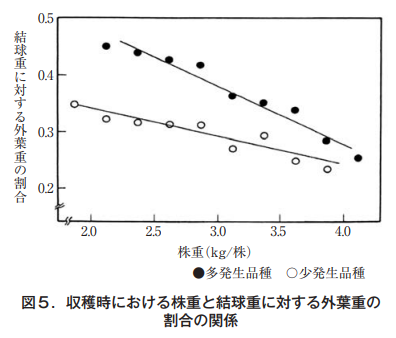
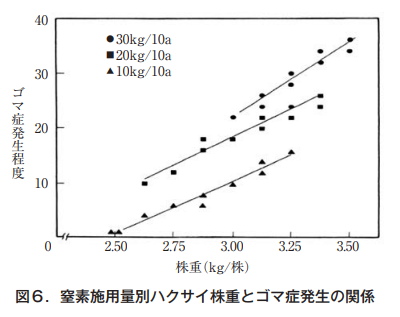
ゴマ症多発生(●)及び少発生(○)品種について,株重の異なるハクサイ9株を採取し,全重,外葉重と結球重を測定した。図5に示すとおり,両品種とも大株ほど結球重に対する外葉重の割合が少なく,こうした傾向は多発生品種でより顕著であった。すなわち,大株ほど結球に供給する物質生産力が劣ると言える。圃場を基肥窒素施用量10,20,30kg/10aの3種類に区分した(3反復)。追肥窒素量は,定植後20,30,40日目にいずれも5kg/10aを施用した。
The results showed that the higher the amount of nitrogen applied, the heavier the plants were and the more sesamosis occurred (Figure 6). Even when plant weights were the same, the incidence of sesamosis was greater with higher amounts of base fertilizer nitrogen. This indicated that not only heavier plants but also higher nitrogen absorption was significantly related to higher incidence of sesamosis.
Histochemical changes in the development of sesamoidosis
The morphological change process at the site of sesamoid development is shown in A-D.
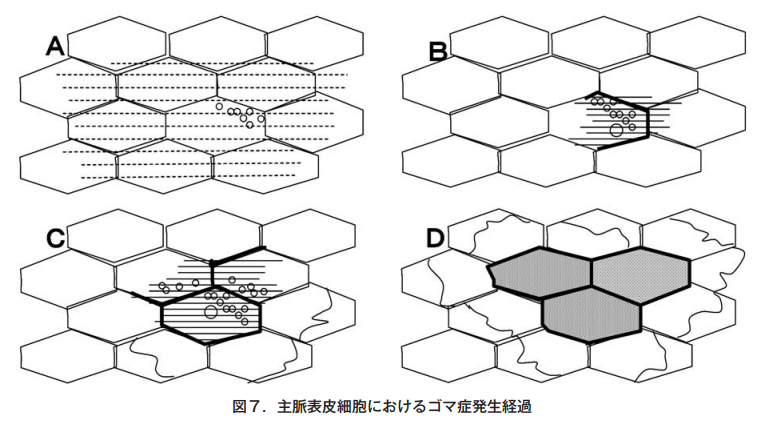
A ゴマ症は,主として結球葉の主脈表層(結球の内側)に発生する。
タイプ1のゴマ症は,未成熟葉の主脈に硝酸態窒素が過剰に供給される葉に発生し,タイプ2は,収穫期に葉位25から45の主脈に著しく発生した(図2)。タイプ2は,表皮細胞の原形質濃度が低下すると,顆粒内濃度は相対的に高くなり,水分が供給されると顆粒が肥大する。顆粒肥大周辺に,アゾ試薬もしくはアンモニアを垂らすと黄緑色になり,クロロゲン酸(フェノール)の存在が示された。
B 細胞内顆粒が肥大する範囲が次第に拡大し,核も肥大する。その範囲はスルファニール酸試薬により燈黄色に反応し,ポリフェノールの存在が示され,さらに細胞壁の一部が褐色に変化した(表1)。
C 顆粒の肥大が多く認められ,細胞壁の褐変部分が拡大すると同時に,周辺の細胞に,原形質分離が認められる。ポリフェノールの分布範囲が大きくなるに従い,アスコルビン酸の分布が少なくなり,周辺に,細胞内顆粒の肥大が認められた。なお,窒素が多すぎて糖分が少なくなるとポリフェノールの還元が阻害される(表1,2)。
D 3~6個の細胞壁が全面褐変し,その周辺の細胞は全て原形質分離を起こした。原形質分離により周囲の細胞との連絡が不可能になることから,褐変細胞が増えることはなく,ゴマ状の斑点となった。
Effect of increased nitrogen fertilization on total sugar and ascorbic acid content
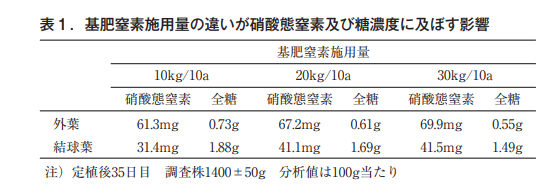
窒素施用量が多くなるに従い,結球葉に対する外葉の割合は少なくなり(図5),硝酸態窒素含量が多く,全糖含量が不足する傾向がある(表1)。
When nitrogen application is reduced over the entire period, the ratio of outer leaf weight to tuber weight increases, resulting in a higher sugar supply to the main vein. Since sugar (glucose) is a precursor of ascorbic acid (Table 2), it is considered that the polyphenol (brown) changes to phenol (colorless) when nitrogen application is reduced, and the incidence of sesame disease is relatively low.
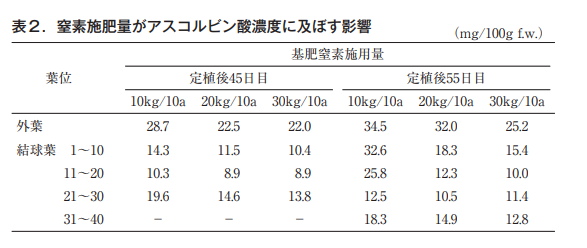
Concerning ascorbic acid at 55 days after planting in Table 2, the decrease in concentration at tuber leaf level 11 to 30, where the incidence of sesameosis is highest in the 20 and 30 kg/10a basal fertilizer treatments, was considered to be due to its use to change from polyphenols to phenols. The fact that the concentration did not decrease in the 10 kg/10a nitrogen-applied area, where the incidence of sesame seed disease is low, was considered to be due to the low incidence of sesame seed disease. A slight decrease was observed at leaf level 11 to 20 on the tuber leaf at 45 days after planting, but it was not extreme.
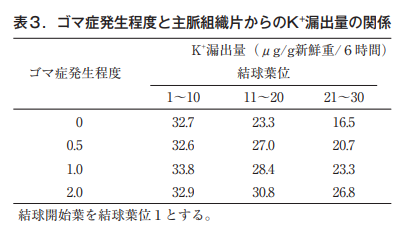
窒素施用量の増加が細胞からのK⁺漏出に及ぼす影響
結球開始葉位1から10枚ごとに区分し,各区の主脈組織片からのK⁺漏出を調査した(補足資料2)。なお,K⁺漏出量の増加は,細胞膜の弱体化,老化により起きると報告されている(辰巳ら)。
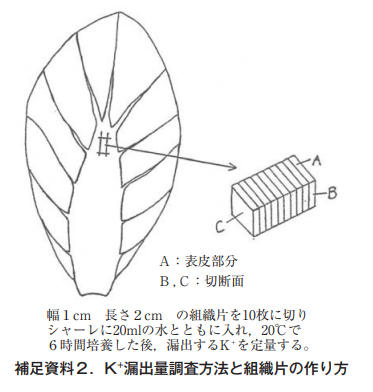
ここでは,結球開始に近い葉(葉位1~10),ゴマ症の発生の多い葉でK⁺漏出量が多くなった(表3)。結球開始に近い葉は大型で,細胞も大きく,窒素濃度も高く(図2)エイジが進んでいるので,K⁺漏出量が多くなったと考えられた。そのため,水分が供給されるごとに細胞内の原形質濃度が薄くなり,顆粒内溶液濃度との差異が大きくなるので,顆粒内外の溶液濃度を等しくするため顆粒が肥大し,ゴマ症の発生が多くなったと思われる。
References
●辰巳保夫・岩本光宏・頓田卓夫 1981.ウリ科果実の低温障害と果実組織片からのイオン漏出について
園学雑 50:108-113
●谷 利一 1965.カキ炭疽病の病態生理学的研究,特に罹病果実の病態発現にあずかるペクチン質分解酵素の役割 香川大農紀要 18:1-81
●豊田 栄・鈴木直治 1957.稲熱病斑の組織科学的研究 3 病斑周辺の呼吸について 日植病報 22:173-177
●松本美枝子 1987.窒素追肥方法および貯蔵方法が収穫後のハクサイゴマ症の発生に及ぼす影響 富山農技セ研報 1:17-23
●松本美枝子 1988.ハクサイゴマ症の発生とその防止法に関する研究(1) ゴマ症発生中の形態及び組織化学的観察 園学雑 57:206-214
●松本美枝子 1990.ハクサイゴマ症の発生における基肥窒素施用量の影響 土肥誌 61:345-352
No Soil - No. 27 Agriculture and Environmental Issues - Part 2
農地由来の窒素による水質汚濁
前 ジェイカムアグリ株式会社
北海道支店 技術顧問
松中 照夫
As mentioned in the previous article, Japan's food self-sufficiency rate is low, so large amounts of crop nutrients such as nitrogen (N) contained in imported food and livestock feed are brought in from overseas. When large amounts of nutrients are brought into livestock farms in the form of feed and fertilizer, the nutrient cycle in the farm from soil to feed to livestock is disrupted, and nutrients are leaked into the surrounding environment. Among nutrients, N has a particularly negative impact on the environment. Even for arable farmers, when the amount of N brought into the farmland from outside exceeds the holding capacity of the soil, N is leaked into the surrounding environment. When N reaches rivers and groundwater, it causes water pollution, and when it reaches the atmosphere, it causes air pollution and contaminates the environment.
In this issue, we will consider water pollution among the environmental pollution caused by N discharged from agricultural land. Air pollution will be discussed in the next issue.
1. eutrophication caused by water pollution
Sources of substances that adversely affect rivers, lakes, marshes, and other bodies of water through groundwater and surface runoff can be broadly classified into two categories: point sources (specific sources), which can be identified, and areal sources (non-specific sources), which cannot. Point sources (specific sources) and non-specific sources (non-specific sources). In addition to N, other substances such as phosphorus (P) and organic substances are discharged from these sources and cause water pollution.
Nは通常アンモニア態N(NH4⁺-N)の形態で農地に与えられる。与えられたNH4⁺-Nは,土の微生物によって硝化作用を受け,負荷電イオンの硝酸態N(NO3⁻-N)に変化する。Pも通常は,負荷電のリン酸二水素イオン(H2PO4⁻)として土に存在する。つまりNやPの形態はいずれも負荷電のイオンであるため,土が持つ負荷電と反発しあって土に保持されにくい。それゆえ,NやPは河川や地下水に流出しやすく,環境汚染物質になりやすい。
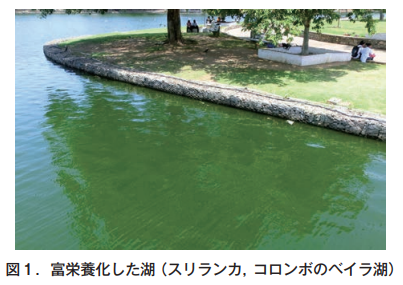
As they flow into lakes and rivers, their concentration increases and nutrients become enriched (this is called eutrophication). When eutrophication occurs, phytoplankton and planktonic cyanobacteria can bloom abnormally and cover the water surface as if green paint had been poured (Figure 1). This is the end point of water pollution.
2. sources of environmental pollutants
(1) Point source contamination
典型的な点源汚染としては,以下のような例がある。すなわち,牛舎,豚舎,鶏舎などの周辺や工場,下水処理場などの近くを通過した河川のN濃度の上昇,あるいは,素掘りふん尿だめ(ラグーン)に貯留したふん尿混合物由来Nによる地下水の汚濁,さらに,放牧家畜が水飲み場として小河川を利用する時,河川に直接ふん尿を排泄することなどである。畜産関連施設近くの井戸水のNO3⁻-N濃度が飲用基準(1リットル当たり10mg)を上回るという各地の事例は,点源汚染の実例である。
(2) Surface source pollution
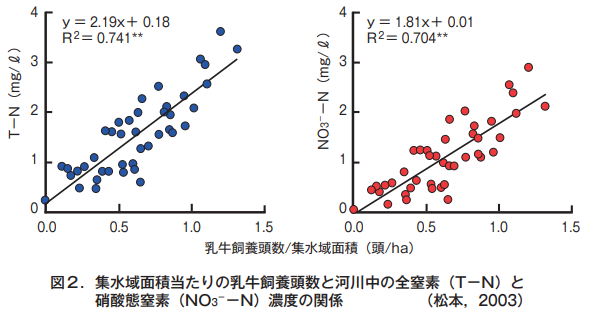
Agricultural land, together with forests and urban areas, is treated as an expanse of land, i.e., a surface source. Pollution caused by areal sources is called areal source pollution. Because the source of this pollution is not specified, it is difficult to quantitatively determine where environmental pollutants originate and to what extent they are discharged into groundwater, rivers, and lakes. However, as the number of livestock per unit catchment area increases, the N concentration in river water increases because the amount of N released increases with the number of livestock (Figure 2). In other words, in the case of areal source pollution, an increase in the amount of pollutants discharged into the environment will certainly increase pollution.
Water Pollution Prevention Measures
(1) Point source pollution control
Point source pollution in livestock farms often occurs when manure overflows from storage facilities and leaks into the environment because the size of the storage facility does not meet the appropriate capacity for the number of animals being kept. To prevent this, manure storage facilities have been regulated by the "Law Concerning the Proper Management and Promotion of Utilization of Livestock Manure" since 1999, and penalties have been imposed on facilities that violate the law.
(2) Measures to prevent surface source contamination - (1) Establishment of allowable limit N
面源汚染を防ぐには,地下浸透水のNO3⁻-N濃度の監視が重要である。NO3⁻-N濃度は,農地に与えるNと作物が吸収するNの収支結果と,土を浸透する水の量によって決定される。したがって,NO3⁻-Nの地下浸透による水質汚濁を防ぐには,まず農地に与えるN量を,自然の自浄力によって汚染物質による環境への悪影響が生じない環境の収容力(これを環境容量という)の範囲に抑えておくことが重要である。この他,作物のN吸収が旺盛でない時期にNを農地に与えることも避けるべきである。
Based on this concept, the European Union (EU) legally regulates the amount of N derived from livestock manure up to 170 kg/ha as an acceptable limit for agricultural land. In Japan, there is no such regulation for surface source pollution. Therefore, even if point source pollution is prevented by legal regulations on manure storage facilities, there is no limit to the amount of N that can be given to farmland, and thus prevention of areal source pollution is not thoroughly implemented. As a result, it has been pointed out that in nine prefectures with large numbers of livestock per unit area (Gunma, Kanagawa, Aichi, Tokushima, Kagawa, Nagasaki, Miyazaki, Kagoshima, and Okinawa), the estimated N concentrations discharged to groundwater all exceed drinking standards (Hojido et al., 2003).
(3) Measures to prevent surface source pollution - (2) Use of topographic chains and buffer zones
具体的な面源汚染防止対策として,例えば茶園-畑-水田-湿地-河川というように,高位置から低位置へ続く地形連鎖の利用が有効である。高位置の農地から地下浸透したNO3⁻-Nは,低位置の農地の作物で再利用され,最終的に水田や湿地などの還元条件(酸素が不足した状態)で環境に無害な窒素ガス(N2)に変換されて大気に排出されるため,面源汚染の防止につながる。
農地から表面流去水として水域へ流出する場合は,流出したNO3⁻-Nなどの環境汚染物質が河川や湖沼に到達するまでに,自然浄化を受ける機会を多くすることが汚染防止対策となる。そのために,河川のそばに湿地や林地を設けて河川への流入の緩衝帯として利用すると,自然浄化がすすみNO3⁻-N濃度が低下する。
The degree of remediation is greater when the distance between the source and the river is planted with crops, such as grassland, than in bare soil conditions. The required width of the buffer zone for this purpose is several to several tens of meters for point source pollution control and several tens of meters for area source pollution. However, since the effectiveness of this buffer zone varies greatly depending on land conditions, no specific standard for the required width of the buffer zone has been established.
General Index of Previous Editions of this Journal in 2023
<1月号>
§Aiming to be a company that continues to contribute to Japanese agriculture
ジェイカムアグリ株式会社 代表取締役会長 浅野 進
§ Super-efficient fertilization of sudachi
徳島県立農林水産総合技術支援センター 資源環境研究課 新居 美香
No § Soil - No. 18
How plants absorb insoluble substances
-根から溶解を助ける物質を分泌する-
ジェイカムアグリ株式会社 北海道支店 技術顧問 松中 照夫
<2月・3月合併号>
§水田土壌の粘土含有量と炭素含有量から根こぶ病防除に必要な転炉スラグおよび消石灰の施用量を計算する方法
東北農業研究センター 畑作園芸研究領域 野菜新作型グループ 山口 千仁
No § Soil - No. 19
Until the absorbed nitrogen becomes protein.
-植物は必要なアミノ酸をすべて自給する-
ジェイカムアグリ株式会社 北海道支店 技術顧問 松中 照夫
<4月号>
§気象変動条件下における水稲に対する「苗箱まかせ」の有用性の考察
株式会社ファーム・フロンティア 取締役会長 藤井 弘志
No § Soil - No. 20
Affects the taste of agricultural products
タンパク質と炭水化物はトレードオフの関係
前 ジェイカムアグリ株式会社 北海道支店 技術顧問 松中 照夫
<5月号>
§メロンとキュウリのマグネシウム,カリウムの欠乏症状と再移動
元 岡山大学大学院 自然科学研究科 桝田 正治
No § Soil - No.21
Why is it said that "the soil is alive?
-土は生き物なのか
前 ジェイカムアグリ株式会社 北海道支店 技術顧問 松中 照夫
<6月号>
§肥料殻の流出を防ぐためのIB肥料や崩壊性被覆肥料(Jコート)による被覆肥料代替効果の検証
愛媛県農林水産研究所 黒瀬 咲弥 森重 陽子
§アスパラガス栽培において被覆尿素肥料で窒素を3割減肥できる環境負荷低減施肥技術
熊本県農業研究センター 生産環境研究所 土壌環境研究室 山下 瑛
No § Soil - No.22
地球上の生命を育み,地球環境を保全する土の役割
前 ジェイカムアグリ株式会社 北海道支店 技術顧問 松中 照夫
<7月号>
§被覆肥料「Jコート® Quick」を用いたドローンによる水稲の局所追肥技術
石川県農林総合研究センター農業試験場 作物栽培グループ 専門研究員 有手 友嗣
§ Reports on production areas
富士伊豆農業協同組合 韮山営農経済センター管内における大玉トマトとイチゴのエコロング施肥体系の紹介
静岡県富士伊豆農業協同組合 韮山営農経済センター 小鹿 浩睦
No § Soil - No. 23
There was no soil on the primitive earth.
-こうして地球に土が誕生した
前 ジェイカムアグリ株式会社 北海道支店 技術顧問 松中 照夫
<8月・9月合併号>
§水稲における高密度播種と育苗箱全量施肥栽培を組み合わせた省力技術
熊本県農業研究センター 生産環境研究所 土壌環境研究室 田中 一成
§ Labor-saving fertilization method in the seedling stage of strawberry "Amaou
福岡県農林業総合試験場 筑後分場 龍 勝利
No § Soil - No.24
Soil is a product of the environment
-風化と生物の作用が岩石から土をつくる
前 ジェイカムアグリ株式会社 北海道支店 技術顧問 松中 照夫
<10月号>
§茨城県のレンコン栽培における窒素適正施肥技術の開発
茨城県農業総合センター 園芸研究所 土壌肥料研究室 鹿島 啓司
§酸性デタージェント可溶有機態窒素含量を用いた有機質資材窒素肥効見える化の取り組み
農研機構 九州沖縄農業研究センター 暖地畜産研究領域 主席研究員 古賀 伸久
No § Soil - No. 25
Agriculture is the beginning of environmental destruction.
-人間活動と環境との関わり-
前 ジェイカムアグリ株式会社 北海道支店 技術顧問 松中 照夫
<11月号>
§Jコート肥料を用いた水稲の全量基肥施肥と被覆樹脂殻の崩壊性
長野県農業試験場 上原 敬義 吉川 直人
No § Soil - No.26
Agriculture and Environmental Issues - Part 1
わが国の窒素循環の問題点
前 ジェイカムアグリ株式会社 北海道支店 技術顧問 松中 照夫
<12月号>
§ Growth of Chinese cabbage and nitrogen application
元 富山県農業技術センター 松本 美枝子
No § Soil - No. 27
Agriculture and Environmental Issues - Part 2
農地由来の窒素による水質汚濁
前 ジェイカムアグリ株式会社 北海道支店 技術顧問 松中 照夫
§2023 General Table of Previous Editions of this Journal