
Site Search
Search within product
第729号 2021(R03).04発行
Click here for PDF version
§湛水条件下の水田土壌の可給態リン酸の温度反応とその推定
Graduate School of Agriculture, Tohoku University
Field Science Center for Ecological Field Education and Research
教授 西田 瑞彦
§気候変動緩和と肥効調節型肥料
Graduate School of Horticulture, Chiba University
名誉教授 犬伏 和之
of paddy soils under waterlogged conditions.
可給態リン酸の温度反応とその推定
Graduate School of Agriculture, Tohoku University
Field Science Center for Ecological Field Education and Research
教授 西田 瑞彦
Introduction
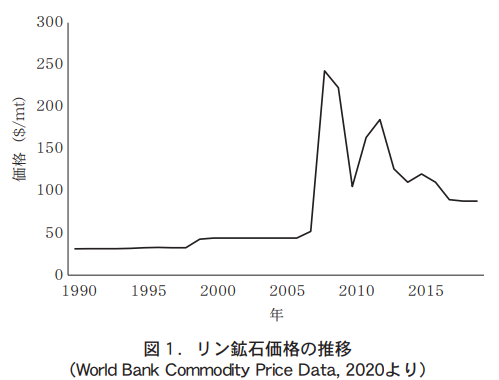
米国地質調査所によれば,世界のリン鉱石の経済埋蔵量は690億トンで,2019年単年での産出量2.4億トンのおよそ290倍に相当する(U.S. GeologicalSurvey 2020) 。経済埋蔵量は鉱床の枯渇,新たな鉱床の発見,技術の進歩による採掘可能量の増加等により変動し,ひと昔前に言われたよりは長期に経済的な採掘が可能と見込まれている。しかし,その埋蔵量に限りがあることは確かである。また埋蔵量は北アフリカ〜中東や中国などで多く,世界の一部地域に偏在している。そのため,これらの地域の情勢によっては,供給が不安定になりかねない。リン鉱石の価格は2008年に急騰し,現在はそれより低く推移はしているが,急騰前より高い状態が続いている(図1)。
In Japan, the impact of the phosphate fertilizer imports is significant because the country relies entirely on imports, and the need for efficient use of phosphate fertilizer was strongly recognized when the price of phosphate ore rose sharply. As a result, the possibility of fertilizer reduction based on soil diagnosis was studied on a nationwide scale. At the same time, studies were conducted on the variation of soluble phosphoric acid in soil. Here, we introduce a study by the authors (Nishida et al., 2018) on the relationship between temperature and changes in soluble phosphate in paddy soils under waterlogged conditions. This study was conducted at the Daisen Research Station, Tohoku Agricultural Research Center, National Agricultural Research Institute, Japan.
2. relationship between soluble phosphoric acid and integrated temperature under waterlogged conditions
In paddy fields, phosphate deficiency is particularly problematic in the early growth period when the root system is not fully developed. Typical symptoms of phosphate deficiency are reduced offshooting, which leads to a lack of ear number and reduced crop yields. Because the deficiency symptoms are enhanced by low temperatures, cold-weather soils require higher levels of available phosphate than warm-weather soils. Shiga and Yamaguchi (1976) found that 22 mg/100 g of Bray No.2 phosphate is sufficient in a normal year, but 40 to 50 mg/100 g or more is required in a cold year to prevent yield loss with no phosphate fertilizer application in cold regions.
This suggests that the relationship between soil phosphate availability and temperature under waterlogged conditions during the paddy rice growing season is particularly important under cool weather conditions. Therefore, we collected paddy soil samples from all over Japan (Akita, Iwate, Yamagata, Miyagi, Tochigi, Ibaraki, Niigata, Aichi, Okayama, Fukuoka, Miyazaki, and Kagoshima) and incubated them under waterlogging conditions at 10°C, 17.5°C, and 25°C in moist soil to investigate the relationship between temperature and soluble phosphate under waterlogging conditions.
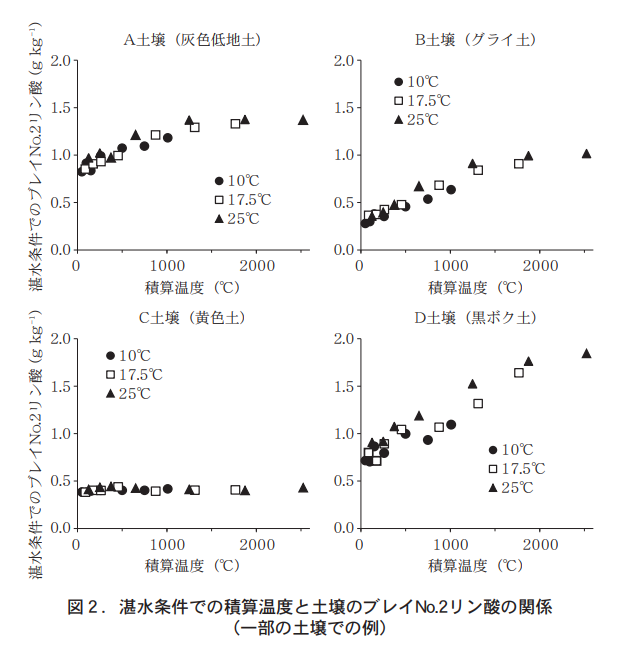
Figure 2 shows the relationship between the total temperature and the availability of phosphoric acid (Bray No. 2 phosphoric acid) under waterlogged conditions for several soils. The relationship between total temperature and Bray No. 2 phosphate was similar at different incubation temperatures. Therefore, all subsequent analyses were based on the integrated temperature without distinguishing the incubation temperature conditions. The values of Bray No. 2 phosphate under waterlogged conditions and their variation with integrated temperature differed among the soils. In many soils, Bray No. 2 phosphate tended to increase with increasing integrated temperature, while in others it remained almost unchanged.
3.Estimation of the relationship between soluble phosphoric acid and accumulated temperature under waterlogged conditions at the early stage of rice growth.
As mentioned earlier, phosphate deficiency in paddy fields becomes a problem in the early stage of growth. In Daisen City, Akita Prefecture, a cold region, the accumulated soil temperature (5 cm deep in the ground) in the paddy field during the month (May 20 to June 20) just before the transplanting and drying out was 650°C on average over the four years. Bray No. 2 phosphate increased almost linearly under waterlogging conditions up to the integrated temperature of 650°C (Figure 2). Therefore, we considered that these relationships could be expressed as a straight line and performed a regression analysis. As a result, significant positive correlations were found except for four soils where Bray No.2 phosphate did not change significantly with increasing integrated temperature (data omitted).
Therefore, it was thought that the changes in Bray No. 2 phosphate up to an integrated temperature of 650°C could be expressed by a first-order regression equation specific to each soil. However, to obtain this soil-specific regression equation, a waterlogging experiment with moist soil is necessary. Since this would require time and labor, it would be desirable to be able to estimate the change in Bray No. 2 phosphoric acid under these waterlogged conditions using the analysis of air-dried soil. Therefore, we next examined the possibility of estimating this regression equation using the analyzed values of air-dried soil.
We first examined the intercept of the regression equation for each soil, i.e., the relationship between the initial value of Bray No. 2 phosphoric acid after waterlogging and the analyzed value using air-dried soil (Table 1). Subsequent analyses were conducted separately for the non-black-bok soils (15 gray lowland soils, 3 gley soils, 1 gray plateau soil, and 1 yellow soil) and the black-bok soils (6 soils). The strongest correlation was found between Bray No. 2 phosphate (R2 = 0.947*) in the air-dried soils and the phosphate absorption coefficient (R2 = 0.920) and the intercept of the regression equation in the non-black soil (Table 1, Figure 3). These results suggest that the initial value of Bray No. 2 phosphate after waterlogging (intercept of the regression equation) can be estimated by the Bray No. 2 phosphate of air-dried soil in the non-black soil and by the phosphate absorption coefficient in the black soil.
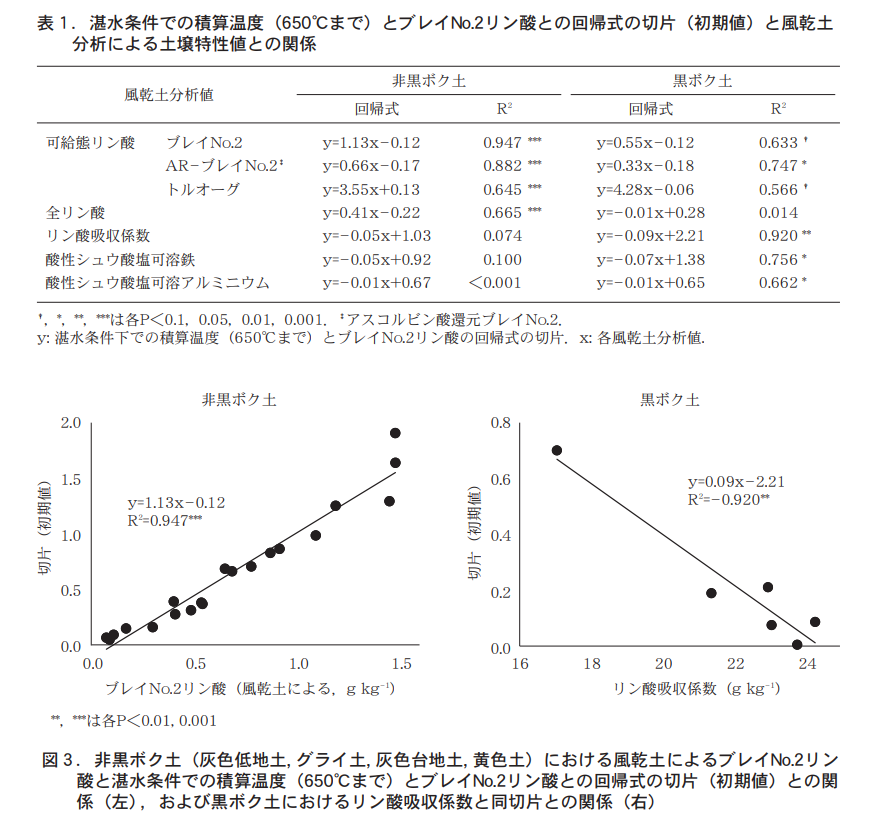
It is not difficult to understand that the initial value of Bray No. 2 phosphate after waterlogging wet soil can be estimated by the Bray No. 2 phosphate value of air-dried soil. However, a strong negative correlation was observed between the initial value of Bray No. 2 phosphate after waterlogging and the phosphate absorption coefficient in the black granite soil. This is interesting because it indicates that the ability to adsorb and fix phosphoric acid determines the initial value of Bray No.2 phosphoric acid after waterlogging, rather than the ability to supply phosphoric acid, which is evaluated by the availability of air-dried phosphoric acid.
次に湛水条件での積算温度に対するブレイNo.2リン酸の増加の程度(回帰式の傾き)について検討した(表2) 。非黒ボク土,黒ボク土ともにアスコルビン酸還元ブレイNo.2リン酸とブレイNo.2リン酸との差(非黒ボク土:R2=0.826, 黒ボク土:R2 =0.847), あるいはアスコルビン 酸還元ブレイNo.2リン 酸とトルオーグリン酸 との差(非黒ボク土: R2 =0.830,黒ボク土:R2=0.739*)との間に強い正の相関が認められた(表2,図4) 。これは還元条件での可給態リン酸(アスコルビン酸還元ブレイNo.2リン酸)と非還元条件の可給態リン酸(ブレイNo.2リン酸,トルオーグリン酸)との差によって,湛水条件でのブレイNo.2リン酸の積算温度に対する増加程度を推定できることを示している。

On the other hand, the highest coefficient of determination in the black granite soil was the phosphate absorption coefficient (R2 = 0.936), which showed a strong negative correlation (Table 2, Figure 4). This indicates that in addition to the ability to supply phosphoric acid, the ability to adsorb and fix phosphoric acid strongly affects the extent to which Bray No. 2 phosphoric acid increases with temperature under waterlogging conditions in the black granite soil. In other words, the initial value of Bray No.2 phosphate under waterlogging conditions and its subsequent change with accumulated temperature are strongly limited by the ability to adsorb and fix phosphoric acid in the black granite soil.
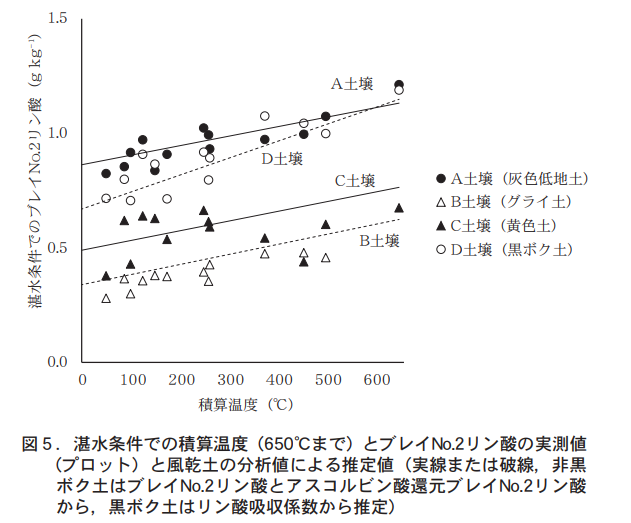
The above results suggest that the changes in Bray No.2 phosphoric acid and its total temperature in cold climates under waterlogging conditions about one month after transplanting can be estimated from the availability of air-dried soil phosphate (Bray No.2 phosphoric acid and ascorbate-reduced Bray No.2 phosphoric acid) in the case of non-black soil and from the phosphate absorption coefficient of air-dried soil or availability of Bray No.2 phosphoric acid (Bray No.2 phosphoric acid and ascorbate-reduced Bray No.2 phosphoric acid) in the case of black soil. Phosphate (Bray No.2 phosphate and ascorbate-reduced Bray No.2 phosphate) for black granite soils. Examples of estimations for several soils are shown in Figure 5.
4. Conclusion
In this study, the response of soil soluble phosphoric acid to temperature under waterlogged conditions was determined for a wide range of soils. In this study, the Bray No. 2 method (quasi-method) was used to analyze the soluble phosphoric acid in soils under waterlogged conditions. The solid-liquid ratio of extraction was 1:20 according to the Soil Environmental Analysis Method. However, the basic target values for improvement of paddy soil in the basic guidelines for soil fertility enhancement and the diagnostic standard values at the prefectural level are almost always set using the Tor-Og method. In a previous study by Shiga and Yamaguchi (1976), the solids/liquid ratio was 1:10 and the Bray No. 2 method was used for analysis of free-form phosphoric acid.
When more effective use of phosphorus resources is strongly required and more precise soil diagnostic standard values are needed, it will be effective to clarify the relationship between analytical values by each method and to integrate these findings.
thanks
The authors would like to express their deepest gratitude to the late Dr. Koji Yoshida, who conducted this research with us and provided guidance and encouragement throughout. The authors would like to express their gratitude to the agricultural research institutes in each prefecture, the Kyushu-Okinawa Agricultural Research Center of the National Institute of Agrobiological Sciences, and Tohoku University for their cooperation in soil sampling for this study.
References
●Mizuhiko Nishida, Koji Yoshida, Tomoki Takahashi. 2018.
Estimation of changes in available soil phosphate under submerged conditions associated with temperature during the tillering stage of rice plant in the cool climate region of Japan.
Communications in Soil Science and Plant Analysis. 49. 1695-1706.
●志賀一一, 山口紀子.1976.
寒地稲作における土壌の燐酸肥沃度及び燐酸施肥の効果に関する研究 第3報
窒素施用量及び年次変動との関係. 北海道農業試験場研究報告. 116. 139-155.
●U.S. Geological Survey. 2020.
Mineral Commodity Summaries.
https://www.usgs.gov/centers/nmic/phosphate-rock-statistics-and-information
Climate Change Mitigation and Fertilizer Regulation
Graduate School of Horticulture, Chiba University
名誉教授 犬伏 和之
Introduction
日本も温暖化防止のため2050年にカーボン・ニュートラルを目指すことになったのは記憶に新しいところですが,世界的にもこの目標は気候変動の影響を最小限にするため,妥当と言えるでしょう。ポスト・コロナで欧州も一層の循環型社会を目指すグリーン・リカバリー(緑の復興)を旗印に掲げています。農業活動での温室効果ガス削減については,本誌でも既に紹介されています1)が,本稿では特に温室効果の高い一酸化二窒素(N2O)の農地からの放出や制御のための肥効調節型肥料の効果などについてアジアの事例を紹介します。
2.一酸化二窒素(N2O)の世界での収支と生成
グローバル・カーボン・プロジェクト(GCP)は,一酸化二窒素(N2O)の全ての発生源と吸収源を詳細に網羅した世界のN2O収支「世界の一酸化二窒素収支2020」を公表しました。この研究成果をまとめた論文は,2020年10月8日に国際学術誌Nature2)に掲載されました。10月29日にはGCPつくば国際オフィスと地球環境研究センター,JAMSTEC,Future Earth日本ハブの共催で,オンラインによる公開フォーラムが開催されました。このフォーラムでは,論文の共同執筆に参加した研究者,特に農業や食料生産,土壌や肥料といった分野を専門に研究している講師が詳しく解説し,筆者も「土壌の視点から見るN2O発生のプロセスと実現可能な緩和」と題して,N2O放出に及ぼす影響因子とN2Oの緩和策について報告しました。
まず地球環境研究センター物質循環モデリング・解析研究室の伊藤昭彦室長は,世界のN2O収支(2007〜2016年)の概要を紹介しました(図1) 。N2Oの放出には自然起源(57%)と人為起源(43%)があり,自然起源の放出量は9.3Tg(1Tg=1012g,100万トン) ,人為起源放出量が7.3Tgです。合計すると約17Tgが毎年放出されています。
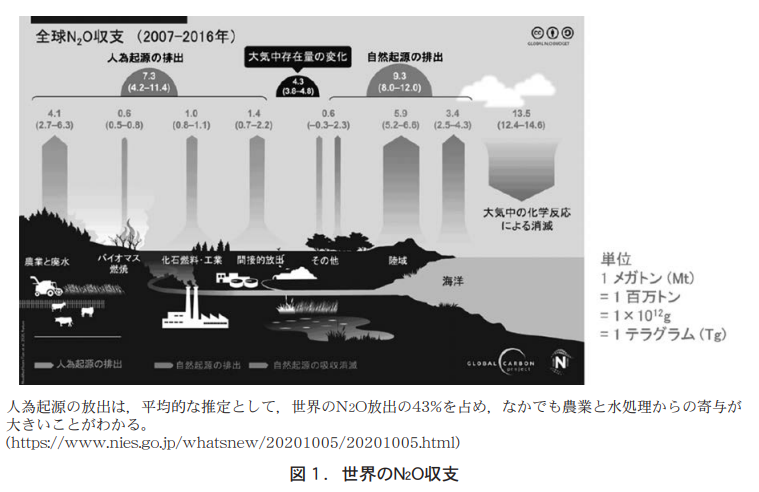
一方,成層圏や対流圏での化学反応により毎年13.5Tg消滅します。差し引きすると毎年3.5Tgが大気中に残ることになります。地域別では,アフリカが最大の放出源(年間約3Tg)です。アフリカは面積が広いことと,熱帯林から放出されるN2Oが多いためです。熱帯林は年間を通じて温度が高く降水量が多いため,微生物の活動が活発でN2Oが放出されやすいと考えられています。次が南米,東アジアで,年間約2Tgです。南米はアフリカ同様に熱帯林からの放出が多いのですが,東アジアは農業からの放出が突出しています。海洋からも年間2〜3Tg放出していますが,推定方法で差があり不確実性が残っています。
世界のN2O放出量は毎年1%以上増加しています。農業は最大の人為起源放出源です。人為起源放出量の地域別の変動を見ると,近年,農業活動が盛んなアジア,次いで南アメリカとアフリカから放出量が増加しています。特に東アジアの増加は農地における化学肥料・堆肥投入量(+直接排出)の増加と関連があり,この30数年間で2倍以上になっています。
3.N2Oの生成と影響因子
続いて,筆者がN2O生成のプロセスを紹介し,好気的な条件での硝化(アンモニアが微生物によって酸化され,亜硝酸塩や硝酸塩に変化する)での副産物の場合と,水田のように嫌気的条件での脱窒(土壌中の硝酸性窒素が還元され,大気中に分子状の窒素として放出される)での中間産物の場合があることを述べました。
N2Oの発生に影響を及ぼす因子として,1. 土壌の種類,2. 添加物(バイオ炭など),3. 土壌管理と制御(緩効性肥料,硝化抑制剤など),4.水田圃場の水管理,メタン発生制御との関係(メタンとN2Oのトレードオフ)があります。本稿では紙面の関係で,特に3. と4. について紹介します。
4.土壌管理とN2O放出の制御
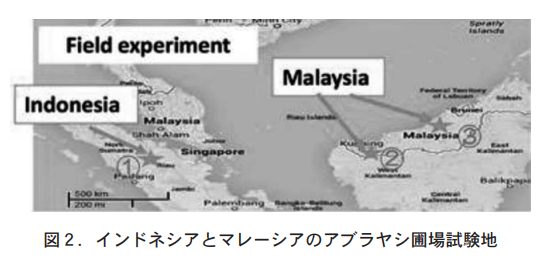
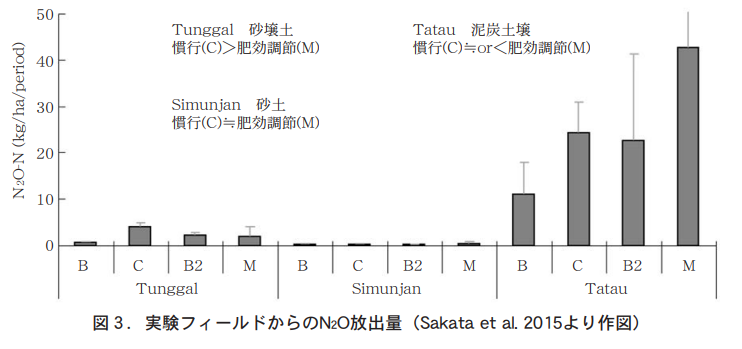
近年,熱帯林が開発され植物油脂原料であるアブラヤシのプランテーションが急激に増えているなかで,インドネシア1か所(Tunggal,図2の①),マレーシア2か所(Simunjan,図2の②;Tatau,図2の③)の大規模農園で,有機物が少ない無機質土壌(①,②)と有機物が多い泥炭土壌(③)に,1) 無肥料区(B),2) 従来方法の施肥量で化学肥料を表面施用する慣行区(C),3) 部分耕起だけの区 (B2),4) 肥効調節型肥料(ジェイカムアグリ,MEISTER (LPコート))を半分の施肥量にして部分耕起後に与えた試験区 (M) を設け,N2O放出を340〜580日間測定し比較してみました3)The following is a list of the most common problems with the "C" in the "C" column.
Tunggalからは肥効調節型肥料によってN2O放出が有意に下がりました(図3) 。Simunjanは雨が多いところなので肥料が流れてしまい放出量は少なくなりました。アブラヤシの収量は肥料を半分の量にしても肥効調節型肥料とほとんど変わらなかった4)ので,ロスが少なくN2O放出も抑えられることがわかりました。一方,泥炭地のTatauではN2O放出が桁違いに多く,肥料の効果も明確ではありませんでした。熱帯土壌でもその種類によって,効果は大きく異なることが分かりました。
もう一つの緩和策として,期待されているのが硝化抑制剤です。硝化の過程にはアンモニアの酸化と亜硝酸の酸化があり,これらをブロックすることでN2Oの放出を抑える抑制剤が開発されており,ジシアンジアミド(DCD)など化学合成品は現在すでに肥料の一部に混ぜて使われています。インドネシアのマカッサール大学や国際農林水産業研究センターで開発されている植物由来の硝化抑制物質はN2Oの放出をかなり抑制できます5)。今後,実用化が期待されています。
5. water management in rice paddy fields and its competitive relationship with methanogenesis
水田から放出される温室効果ガスのメタンを水管理方法の変更で減らすため,日本では中干し延長などが効果を示していますが,海外での有効性を確かめるため,インド南部のタミルナドゥ農業大学と共同で圃場実験を行いました(図4)6)。地下水位を数日おきに15cmくらいまで下げるような間断灌漑と幼苗一本疎植を組み合わせた高収量稲作法(SRI農法)区では,常時湛水の対照区と較べてメタンの放出量を4〜5割下げられ,50%程度節水することができました。
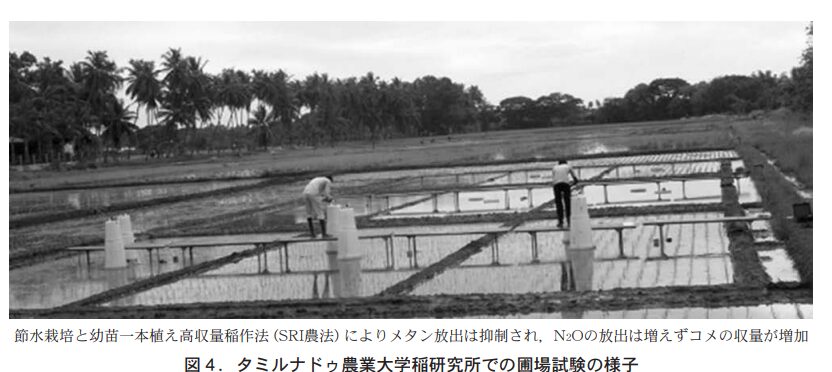
しかもメタン削減でトレードオフ関係にあるといわれ懸念されていたN2O放出に有意な変化はありませんでした。さらに東南アジアのフィリピン,インドネシア,タイ,ベトナムにおいても同様な節水栽培試験をしたところ,メタンは削減でき,N2O放出にはさほど影響がないことを確認しています。
6. at the end
現在の新型コロナによる影響について,国際土壌科学連合(IUSS)元会長のRattan Lal先生の論文7)を紹介します。土壌の健康は人々の健康や貧困解消,気候変動対策の基盤です。今後,COVID-19の影響で人間活動が変容し,それによって食料生産体系が変わり,それに対する土壌管理方法も,今まで以上に持続可能性が重視されるように変貌して行くと予想されます。肥料の生産や利用も影響を受けることは当然考えられます。またN2Oの大気中寿命は約120年と,他の温室効果ガスより1桁長いので,未来への負の遺産とならないように,削減策を進めてゆくべきです。
References
1)斎藤雅典:2019.
農業活動と温室効果ガス排出削減,
農業と科学,令和元年12月号,7−11.
2)Tian H., Xu R., Canadell J.G., Yao Y. et al.:2020.
A comprehensive quantification of global nitrous oxide sources and sinks,
Nature, 586, 248−256.
3)Sakata R., Shimada S., Arai H., Yoshioka N., Yoshioka R., Aoki H., Kimoto N., Sakamoto A.,Melling L., and Inubushi K.:2015.
Effect of soil types and nitrogen fertilizer on nitrous oxide and carbon dioxide emissions in oil palm plantations, Soil Science and Plant Nutrition, 61, 48−60.
4)Sakata R.:2017.
Soil, fertilizer and topography affect emissions of nitrous oxide and carbon dioxide, and yield of oil palm in Indonesia and Malaysia, 千葉大学博士論文.
5)Jumadi O., Hala Y., Iriany R.N., Makkulawu A.T., Baba J., Hartono, Hiola St.F., and Inubushi K.: 2020. Combined effects of nitrification inhibitor and zeolite on greenhouse gas fluxes and corn growth. Environmental Science and Pollution Research, 27, 2087−2095.
6)Oo A.Z., Sudo S., Inubushi K., Mano M., Yamamoto A., Ono K., Osawa T., Hayashida S., Patra P.K., Terao Y., Elayakumar P., Vanitha K., Umamageswari C., Jothimani P. and Ravi V.:2018. Methane and nitrous oxide emissions from conventional and modified rice cultivation systems in South India, Agriculture, Ecosystems and Environment,252, 148−158.
7)Lal R.:2020. Soil Science beyond COVID-19,
Journal of Soil and Water Conservation, 1−3. doi:10.2489/jswc.2020.0408A