
Site Search
Search within product
第762号 2024(R6).07発行
Click here for PDF version
§苗箱まかせの施肥作業時に役立つ早見表と施肥量調整のポイント
Kumamoto Prefectural Agricultural Research Center, Production Environment Research Institute
Soil Environment Laboratory
柿内 俊輔
§福井県における土壌環境の変遷と今後の対策
Jcam Agri Corporation West Japan Branch
技術コンサルタント 長谷川 彰
§土のはなし-第33回
危機に瀕する世界の土-その3
塩類集積による土の劣化とそのリスク
前 ジェイカムアグリ株式会社
北海道支店 技術顧問
松中 照夫
Useful when applying fertilizer by the seedling box.
早見表と施肥量調整のポイント
Kumamoto Prefectural Agricultural Research Center, Production Environment Research Institute
Soil Environment Laboratory
柿内 俊輔
Introduction
Seedling box whole-box fertilization is a low-cost and labor-saving technique that has been widely used by a wide range of rice farmers, both full-time and part-time. Recently, as farmland intensification progresses in Kumamoto Prefecture, this technique has been attracting attention as a technique for reducing production costs and labor hours, and has been introduced by large-scale land-use type farmers.
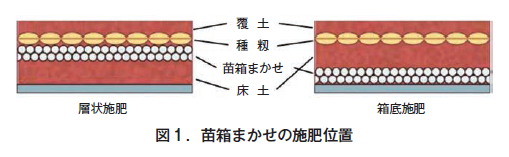
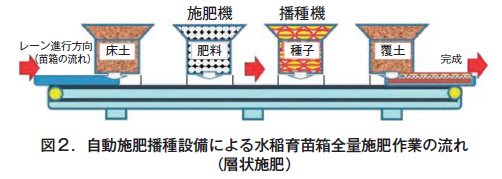
苗箱まかせを用いた育苗箱全量施肥は,施肥位置によって層状施肥と箱底施肥に分けられる(図1)。前者は下から,床土→苗箱まかせ→種籾→覆土,後者は,苗箱まかせ→床土→種籾→覆土の順である。これらの播種や施肥および土入れの行程は,たとえば層状施肥では,図2に示すような自動施肥播種設備が用いられることが多い。
実際,生産現場において自動施肥播種設備を用いて作業する場合,水稲の生育に必要な10a当たりの窒素量と育苗箱数から苗箱まかせの施肥量を計算し,これに基づいて育苗箱1箱当たりの苗箱まかせの施肥量および床土量を決め,自動施肥播種設備を調整したうえで,施肥作業に取り掛かることになる。しかし,この一連の作業では機械(施肥ホッパー)の調整を頻繁に行いながら,施肥量と床土量を決定しなければならず,作業時間のロスや育苗管理の失敗につながるような事例も散見されている。
Here, we have summarized the key points of fertilizer application when using automatic fertilizer application and seeding equipment to apply fertilizer to seedling boxes1) .
2. Testing Method
(1) Creation of a quick reference table for determining the amount of soil medium according to the amount of fertilizer applied.
育苗は,2021年熊本県農業研究センターの水稲育苗用ハウスで行った。育苗箱は稚苗用育苗箱(内径:長さ58cm×幅28cm×深さ3cm)を使用した。肥料は,苗箱まかせN400-120(ジェイカムアグリ社製)を使用した。水稲育苗用培土は熊本県内で一般的に用いられている人工造粒土(4銘柄)を用いた。事前の調査により,いずれの培土とも比重は約1.0であったため,試験にはひのくに床土(菱東肥料社製)を用いた。
In a test to determine the amount of soil according to the amount of fertilizer left in the seedling box, the amount of seed rice was 100 g in terms of dry rice, and the amount of soil cover was fixed at 1,200 g to adequately cover this rice. The amount of seed rice was 100 g in terms of dry rice, and the amount of soil cover was fixed at 1,200 g to adequately cover the rice. The positions of fertilizer application in the seedling box were layered and at the bottom of the box, and the weight of bedding soil that could be filled into the seedling box was investigated according to each amount of fertilizer applied.
To clarify the amount of water retention per seedling box at each fertilizer dose, the weight of the seedling box was measured before and after seedling box irrigation. The weight of each seedling box before irrigation (including the weight of the seedling box) was measured after the seedling boxes were filled with seedling medium and seedling box remnants. The weight of seedlings after irrigation was measured after the seedling boxes had been filled with seedling bedding medium or seedling box remake, irrigated, covered with soil, irrigated again, and left on a sunoko for 120 seconds after gravity water had fully flowed down. The amount of water retention was determined from the difference in the weight of the seedling boxes before and after irrigation.
(2) Investigation of the actual amount of fertilizer applied to seedling boxes in an automatic seeding and fertilizer application system
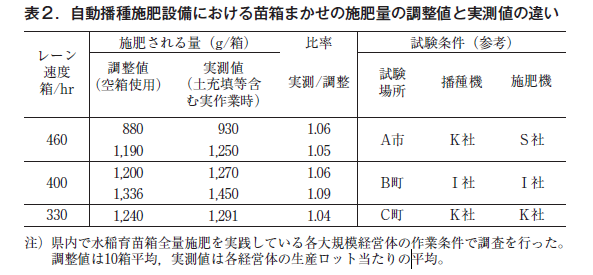
We compared the adjusted amount of fertilizer applied to empty seedling boxes with the actual amount applied to seedling boxes using automatic seeding and fertilizer application equipment used by three large-scale rice seedling management organizations in the prefecture. The adjusted amount of fertilizer applied to empty seedling boxes without soil was used as the adjusted value, while the actual amount of fertilizer applied to seedling boxes under actual seeding conditions with bedding and covering soil was used as the measured value. The adjusted value was the average of 10 boxes, and the measured value was obtained by dividing the weight of the actual boxes by the number of boxes created with the same fertilizer amount setting. When measuring the actual values, the "losses" that were scattered when the boxes were filled into the fertilizer hopper were also included.
Results and Discussion
(1) Creation of a quick reference table for determining the amount of bedding and covering corresponding to the amount of fertilizer applied.
育苗箱1箱当たりの苗箱まかせの施肥量に対する適正な床土量および覆土量を求めるため試験方法に記載した方法に従って早見表を作成した(表1)。
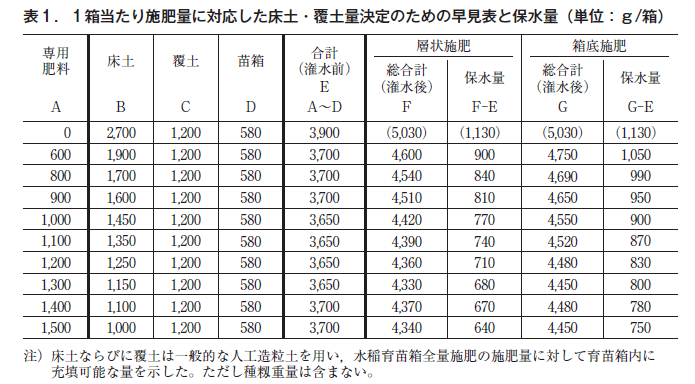
表1において,通常の育苗箱(内径:長さ58cm×幅28cm×深さ3cm)の重量は580g,覆土は1,200gとして慣行育苗を行った場合,培土の重量は2,700gであった。これを基準にして,苗箱まかせの施肥量を増加させた場合,育苗箱への充填が可能な床土の重量は徐々に減少し,概ね苗箱まかせの重量+床土重量=2,700gの関係が成立した。
したがって,苗箱まかせの施肥・播種作業時においてこの早見表を用いれば,1箱当たりの苗箱まかせ施肥量に応じた適切な床土量を瞬時に決めることができる便利なツールであると考えられる。
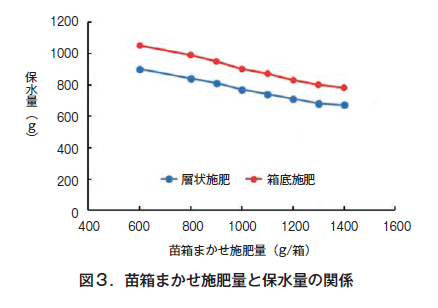
また,表1に示すように,1箱当たりの保水量は苗箱まかせの施肥量が増えるとともに小さくなったが,これは苗箱まかせ自体が保水力をほとんど持たないためで,苗箱まかせが多くなると逆に床土量と覆土量が少なくなり保水量が低下すると考えられる。この関係は施肥位置に関わらず同じであるが,図3に示すように,同じ施肥量・培土量であっても箱底施肥の保水量が常に高く推移していることは,育苗時の水分維持は箱底施肥で容易であることを示唆している。これが苗箱まかせの施肥量が1kg/箱以上の育苗では箱底施肥が推奨される2)理由の一つではないかと推察される。
(2) Key points for fertilizer application when using automatic fertilizer application and seeding equipment
A survey was conducted on the "leave it to the seedling box" fertilizer application system at three large-scale management organizations practicing whole seedling box fertilization in the prefecture.
その結果,各経営体において使用している自動施肥播種設備に装着されている施肥ホッパーはそれぞれ異なるメーカーのものであった。また,自動施肥播種設備においていずれのメーカーの施肥機を用いても,施肥ホッパーの調整値に比べ,実際の苗箱まかせの施肥作業時の施肥量は4~9%多くなった。これは,事前に施肥ホッパーの施肥量を調整する場合,空の育苗箱を通して施肥量を判定しているが,実際の播種作業では育苗箱には培土が充填されており,施肥播種設備のレーン動力部への重量負荷が大きくなるため育苗箱の移動速度が遅くなり,1箱当たりの苗箱まかせの充填量がやや増えると考えられた。
Summary
We have developed a quick reference table to quickly determine the appropriate amount of bedding soil corresponding to the amount of fertilizer to be applied to each seedling box using an automatic seeding and fertilizer application system. Using this quick reference table, the amount of bedding soil corresponding to the amount of fertilizer applied per box can be easily determined, which is expected to improve the efficiency and speed of the fertilizer application work.
また,実際に各大規模経営体で用いられている自動施肥播種設備について,苗箱まかせの施肥ホッパーの調整量と実際量を比較したところ,実作業時では培土の重量がかかるため,調整値よりも実際の施肥量は4~9%多くなることが明らかになった。これを防ぐためには,調整時から(苗箱まかせ+培土)に近い重量負荷をかけながら施肥量を調整する必要があると考えられた。
However, "errors" in the amount of fertilizer applied per box have a negative impact on the growth of rice plants, and also increase the cost of fertilizer application and environmental impact. In particular, recently, oceanic runoff of coated fertilizer shells out of the paddy field system has become a problem, and excessive fertilizer application must be avoided.
In order to solve such problems and promote the use of total fertilizer application to rice seedling boxes, it would be effective to quickly determine the appropriate amount of fertilizer to be applied to each seedling box and the corresponding amount of soil, and to smoothly manage seedling cultivation by using the quick guide table proposed here.
References
1)松森信 自動施肥播種設備利用における水稲育苗箱全量施肥作業の最適化.熊本県農業研究成果情報.No.977.2022.
(2) JCAM Agri (Inc.) Handbook for using "Seedling Box Makase" (Tohoku Edition). 2014.
Changes in Soil Environment and Future Measures in Fukui Prefecture
Jcam Agri Corporation West Japan Branch
技術コンサルタント 長谷川 彰
Introduction.
国連は世界的な人口増加などに対応するため食料の安定生産と安全性を確保し,そして生態系を維持するため土壌を持続的に保全することが不可欠であるとの視点から,2015年を国際土壌年と定めた。これを受けて,国際土壌科学会議(IUSS)は「人類の寡黙な同志である土壌に目を向けよう」と2024年までの10年間を国際土壌の10年とした。
In Japan, JA Zen-Noh launched a soil growing campaign in 1970, promoting "harmonious soil growing" based on soil diagnosis, and in 1971, the first Saturday in October was designated as "Soil Day," a pioneering effort in the world. Subsequently, the Soil Promotion Councils were established at the national and prefectural levels with the aim of contributing to the stability of agricultural production through soil fertility. As a member of the secretariat, I also held training sessions and mutual encouragement meetings in cooperation with the prefectural economic federation and the central association, and conducted patrols to promote soil cultivation throughout the prefecture.
1984年には,地力増進法が制定され,地力を増進するための土壌管理に関する基本的方針が定められた。
戦後の土壌調査の歴史は,食糧増産を図るための基盤となる土壌を対象に,耕土培養事業や地力保全基本調査(1959年~1974年)が実施され,全国の水田,畑地の土壌の性質が明らかになり,土壌の分類やタイプごとの生産力阻害要因や改善対策が示された。その後,国は適切な土壌管理と土地利用方式などを明らかにするための経年的な定点調査事業をおこなっている。
本県においては,これらに加え,県独自の施策として全県を対象に1992年から1995年にわたり土壌保全対策調査事業を実施した。また,経済連が中心となり,2009年から2015年にかけて全県的な土壌分析を実施したが,それ以降全県的な取り組みはなされていない。
Since 1970, when the Basic Survey on Land Conservation was compiled, the environment surrounding agriculture in the prefecture, especially in rice paddies, has changed drastically. The first is the decrease in the number of farmers, the expansion of rice production adjustment and the use of paddy fields, the second is the change in rice production from high-yield to quality-oriented, the third is technological innovation such as fertilizer mechanization, the fourth is the development of production infrastructure, and the environment is changing due to air and water pollution prevention measures and global warming. Here, I would like to discuss future soil management measures by taking a multifaceted view of the changes in the soil environment in this prefecture.
1. decrease in paddy rice acreage and increase in utilization of paddy fields
Fukui Prefecture has one of the highest ratios of rice to agricultural income in Japan, and the adjustment of rice production came as a great shock to farmers. In addition, there were many poorly drained rice paddies, and many issues such as crop selection, land use, and yield potential were piling up.
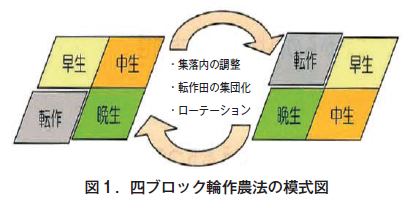
To solve the problem, a "four-block crop rotation" based on community agriculture, in which "the community protects its own farmland", was promoted (Figure 1). Specifically, based on the grouping of rice varieties and the planting of different rice varieties, wheat, soybeans, buckwheat, and fodder crops were positioned as priority crops, and a year-round crop rotation was implemented by rationally combining barley with soybeans and buckwheat as the succeeding crop.
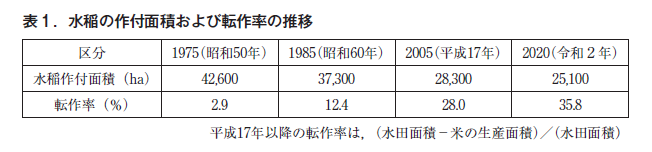
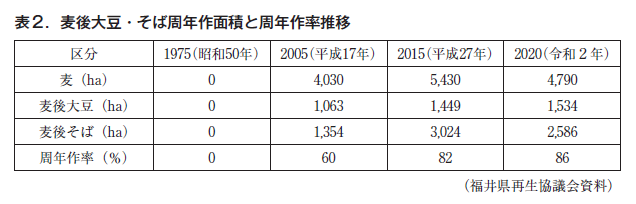
As a result, the area of paddy rice in 2020 was 25,100 ha, a large decrease of about 60% compared to 42,600 ha in 1975 due to the increase in the production adjustment area, but the area of barley, the main crop of shifting crops, increased year by year to 4,790 ha in 2020, and the total area of soybeans and buckwheat after barley was 4,120 ha. The total area of soybeans and buckwheat after barley is 4,120 ha, and the annualization rate after barley is 86%, ranking first in Japan for the area of six-row barley and third for buckwheat (Tables 1 and 2).
このため,本県の水田利用率は,全国の92%,富山県の93%,石川県の88%に比べても105%(2020 年)と高くなっている。
Currently, the percentage of area under shifting cultivation is 36%, a large increase from 2.9% in 1975, and this change in paddy field use is thought to have had no small effect on the physical and chemical properties of the soil.
2. decrease in the number of farmers and increase in business scale through farmland accumulation
(1) Decrease in the number of farmers
Although the prefecture is not blessed with abundant sunlight in winter, it has been engaged in agriculture centering on rice cultivation, taking advantage of the availability of abundant water.
In 2020, the number of farm households decreased by 81% from 56,950 in 1975 to 10,546, due to the aging of the farming population, farmers moving to other industries, and the progress of mechanization. In addition, the percentage of key farmers under the age of 60 is low at 8.8% (22% in Japan, according to the 2015 Census of Agriculture and Forestry), and the aging of the farming population is continuing.
(2) Scale expansion through farmland accumulation
In 1975, the majority of farmers were small-scale farmers, with approximately 70% of their farms less than 1.0 ha in size. Subsequently, in order to secure farm incomes, farmers shifted cultivation to other areas, and organized their production in village units, working together and cooperating with other farmers. Furthermore, with the enactment of the Law for the Promotion of Strengthening Agricultural Management Infrastructure, the number of certified farmers and agricultural cooperative corporations increased, accelerating the accumulation of farmland.
Currently, the main bearers in the prefecture are corporate organizations and large-scale individual farmers that have developed from the community farming that was triggered by the land use of shifting crops, as well as mega-farms with a total area of over 100 hectares, and low-cost farming that takes advantage of economies of scale has progressed. The farmland accumulation rate in 2020 is about 68%, reflecting the actual situation of large-scale farming, where 10% of the farmland is managed by 10% of the farmers (Table 3).
However, looking at individual corporate organizations, many of them are over 70 years old, and the expected successors of the organizations are only able to engage in farm work on holidays due to the extension of employment periods of the companies, etc. Some organizations are in danger of survival due to the weakening of their labor force.
This decrease and aging of farmers and the increase in the scale of farmland accumulation have promoted rationalization of management, including lower costs, but they may also have had some impact on soil management and the environment.

3. change in paddy rice varieties - from quantity to quality
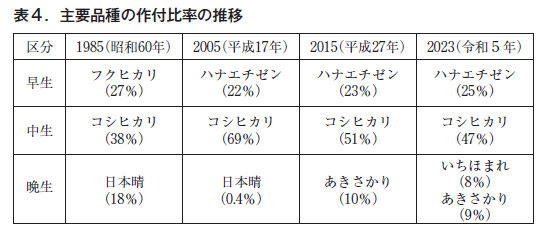
In the 1960s, however, the number of early maturing rice varieties increased due to socioeconomic factors such as the shift to dual-income farming and incentive programs, as well as advances in manure management technology. In the 1970s, when the problem of rice overabundance came to the fore, a voluntary rice distribution system was established, focusing on high-quality rice, and rice varieties shifted from yield to quality and eating quality. Among these varieties, Koshihikari, a variety bred in the prefecture and highly evaluated in the market, became the center of promotion and diffusion, and in 2005, Koshihikari with high price and small amount of fertilizer accounted for 69% of the rice planted in the prefecture (Table 4). The spread of Koshihikari was the result of the tireless efforts of those involved in controlling growth by interrupting nitrogen and improving the method of applying fertilizer with an emphasis on ear fertilizer.
その後も米の供給過剰が進む中,価格や値ごろ感が評価基準となり低価格・多量施肥のハナエチゼン・あきさかりへのニーズが高まった。現在の主要品種は,ハナエチゼン,コシヒカリ,あきさかりが中心となっているが,2016年には良食味・高温耐性のいちほまれが育成され本格生産に取り組んでいる。
On the other hand, one of the characteristics of paddy rice cultivation in this prefecture is the spread of direct seeding technology, which has become established as a low-cost, labor-saving, and season-dispersing paddy rice cultivation technique.
4. changes in fertilizer and fertilizer application standards
(1) Changes in fertilizer components and fertilizer application to Koshihikari
Fertilizers distributed in the prefecture shifted from single fertilizers such as ammonium chloride, ammonium sulfate, lime superphosphate, and potassium chloride in the 1960s to compound fertilizers and chemical compound fertilizers in the 1950s. Subsequently, the development of side-row application machines and slow-release fertilizers progressed, and the spread of one-shot basal fertilizers increased rapidly against the backdrop of a production structure with an extremely high percentage of dual-income farmers, and it is estimated that the spread ratio exceeded 95% in 2022.
The ratio of NPK in fertilizers has changed from fertilizers with a slightly higher P content during the Showa period to the first half of the Heisei period to fertilizers with a higher N content in consideration of the amount of fertilizer used in side-row application machines and the price of fertilizer. In particular, since the 2008's, the spread of ecofertilizers with 20% organic content has increased rapidly in conjunction with the development of ecofarmers and the price of raw materials has skyrocketed, resulting in a further decrease in the PK ratio.
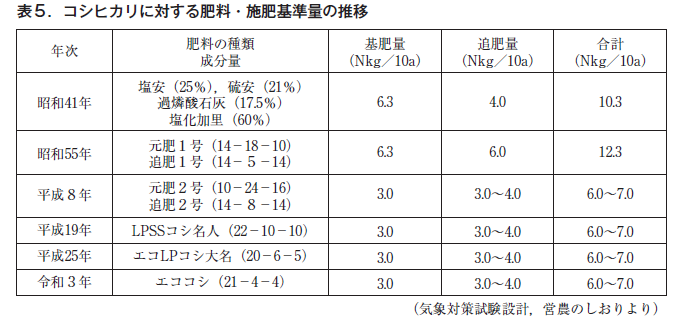
次に,本県の主要品種のコシヒカリのN施肥基準量(表5)についてみると,昭和40年代は基肥中心で約10kg/10a,昭和55年は基肥と追肥は同等で約12kg/10aと現在に比べ多くなっていた。これは転作の強化や高い米価の中で,品質よりも収量性がより重視され,農家の強い所得確保の想いが背景にあったと考えられる。その後,コシヒカリの倒伏性など生育特性の解明が進んだことや食味・品質重視への変化により平成8年のN施肥基準量は追肥の割合がやや高くトータルで7kg程度と昭和55年時に比べ約66%と大きく減少している。このようにNの施肥基準量は,その時代の米を取り巻く生産者・消費者・流通関係者のニーズに添う形で大きく変化してきたと考えられる。当然こうした施肥量や肥料成分の変化は,土壌環境に影響すると考えられる。
(2) Actual conditions of fertilizer application, etc. in recent years
The N fertilizer application amounts (Table 6) for major varieties in this prefecture were calculated based on the planted area and the distribution volume of each fertilizer brand based on the annual fertilizer statistics provided by the Fukui Economic Federation (five-year average from FY 2008 to FY 2022).
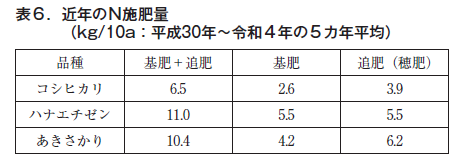
Koshihikari is at a low level of 6.5 kg, aiming for a high score in terms of eating quality and concern about downfall, while Hanaechizen and Akisakari are at a high level of 10 to 11 kg, aiming for higher yield. The diffusion rate of one-shot fertilizers is extremely high, estimated at about 95% based on the volume of fertilizers in circulation.
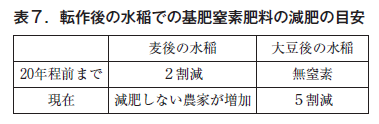
Thus, appropriate nitrogen fertilization according to the rice variety is recommended, but recently there have been some cases of increased fertilization. For example, as shown in Table 7, a 20% reduction of nitrogen fertilizer was usually applied to post-wheat paddy rice until about 20 years ago, but the number of farmers who do not reduce fertilizer application is clearly increasing. Even when a batch application of basal fertilizer is used, some farmers are now applying additional fertilizer around the time of ear formation. This is thought to be because a decrease in soil nitrogen fertility due to shifting cultivation is one of the reasons for reduced yields, and more farmers are increasing nitrogen fertilizer from the viewpoint of securing yields.
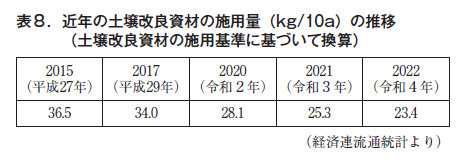
On the other hand, the amount of soil improvement materials applied in recent years (Table 8) has been decreasing year by year against the backdrop of soaring prices and labor shortages, and in 2022 it was 23.4 kg/10a, 63% of the amount applied in 2015. The decrease in the amount of soil improvement materials applied is an important issue, since the soil in this prefecture is originally low in silicic acid content. Efficient application of silicic acid materials based on soil diagnosis needs to be promoted.
5. promote the development of production infrastructure
Since the 1960's, the city has pioneered the development of agricultural land and drainage infrastructure, and as a result, the rate of field development is among the highest in Japan (the highest in all prefectures in 1993).
Since then, in order to produce low-cost, high-quality rice and to improve the productivity of shifting crops such as wheat and soybeans, large plots have been developed, culverts have been drained to dry fields, and water facilities have been pipelined to promote efficient water use (in 2009, the prefecture ranked first in terms of the rate of field development in Japan).
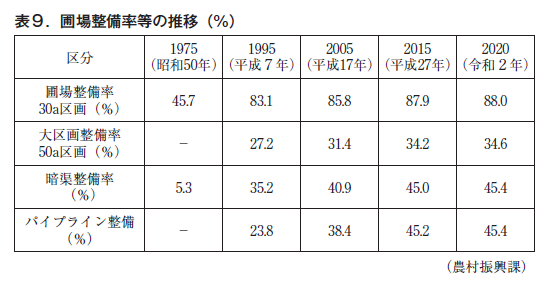
As a result, as of 2020, the maintenance rate within the agricultural zone is 35% for large plots, 431 TP3T for culverts, and 451 TP3T for pipelines, which has significantly transformed the agricultural land that serves as the production base (Table 9).
On the other hand, since the 1960s, mechanization of agriculture has progressed rapidly. From cultivators, walking rice transplanters, and binders to high-performance tractors, riding rice transplanters, and combine harvesters, an integrated system of mechanization was established, and now we are entering the era of smart farming with large, high-tech agricultural machinery.
Such modernization of the production infrastructure has promoted farmland accumulation and low-cost farming, and is thought to have significantly changed the soil environment (soil depth, tillage) and other factors.
6. decrease in the number of leaders in the field
Farm advisors and extension advisors play an important role in providing technical and managerial support to farmers by working in close cooperation with each other and directly with farmers to address issues faced by farmers in the field. The importance of these advisors has been increasing as the issues have diversified widely, from increasing food production when the system was launched to expanding horticultural production areas, fostering new farmers, and promoting mid-mountain and mountainous regions.
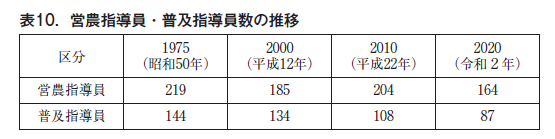
However, as shown in Table 10, the number of farm advisors and extension advisors in 2020 will be 74% and 60% lower than in 1975, due in part to factors such as the merger of agricultural cooperatives and the shift to wide-area activities by extension workers. In addition, in order to respond quickly to increasingly sophisticated technologies and complex regional issues, it is becoming more important to have specialist-type advisors (e.g., for soil fertilizers) rather than all-around advisors.
For this reason, it is necessary to move to a flexible system by enhancing the training system as well as self-training more than ever before. Now is the time when the enhancement of a guidance system without barriers is strongly required.
7. changes in air and water quality
Since around 1970, air and water pollution has become increasingly serious, especially in urban areas, due to such phenomena as photochemical smog. As a result, environmental measures such as the Air Pollution Control Law and the Water Pollution Control Law have been enhanced in order to prevent air and water pollution. In addition, water quality standards for agriculture have been established to ensure that the concentration of water used in agriculture does not damage crops.
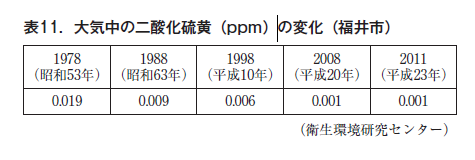
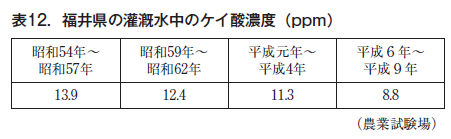
As a result of these efforts, the environment has been greatly improved, and the concentration of sulfur dioxide in the air (in Fukui City) in 2011 was significantly reduced by 5% compared to that in 1978 (Table 11). On the other hand, the silicic acid concentration in irrigation water in the 1990s was 63% lower than in the 1970s (Table 12).
Thus, with the improvement of air and water quality and the concreting of irrigation channel slopes, the amount of nutrients supplied to rice paddies from nature has decreased considerably compared to the past.
8. progression of global warming
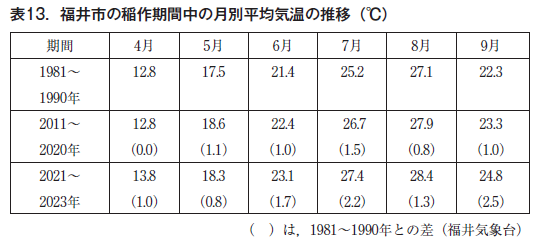
The temperature in Japan is said to be increasing at a rate of 1.30°C per 100 years, and the average monthly temperature during the rice cultivation period in this prefecture (Table 13) shows that the temperature in the 2010s increased by about 1°C over 30 years compared to the 1980s. The temperatures for the three most recent years, starting from 2021, have been even hotter, partly due to this year's extremely hot summer.
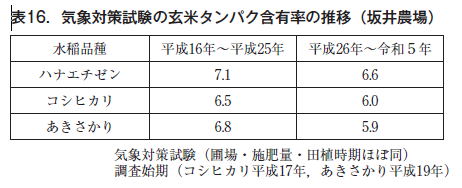
In the 2023 rice crop, the heat wave and other factors accelerated the growth stage of paddy rice, with Koshihikari rice earning its first ears at the end of July, resulting in a slightly lower yield than in normal years. In terms of quality, the percentage of first-class Koshihikari rice was 85%, partly due to the promotion of timely rice planting after May 15 as a measure against high temperatures, and the high temperature tolerant Ichihomare variety maintained a high level at 961 TP3T. The protein content of the main varieties at Sakai Farm was low (5.4-5.6), suggesting that the weather had a large influence, but the effect of soil fertility cannot be ignored.
Global warming countermeasures will become even more important in the future, such as improving paddy rice varieties, soil fertility, water management, and fertilizer management.
9. changes in soil fertility
1) Changes in soil physicochemical properties over a 30-year period (results of the Soil Conservation Measures Survey Project)
県は地力保全基本調査以降,全県を対象に1992年(平成4年)から4年間にわたり土壌保全対策調査事業を実施した(土壌断面調査7,434点,土壌分析2,692点)。
As a result, the following changes were observed in the soil compared to the time of the basic soil fertility conservation survey.
Soil type - Wet rice fields have decreased significantly and dry rice fields have increased.
The total depth of the crop was 13.5 cm, and the number of rice paddies exceeding the target depth of 15 cm was about 36% of the total, which was a decrease.
Soil Nutrients
Decrease in pH - 10% of respondents had a pH of 6 or higher, a significant decrease from the previous 60%.
Base substitution capacity - no significant change
Substitutable potassium - increased from previous
Dietary phosphoric acid - significantly increased compared to last time
Conjugate silicic acid - same as last time, high percentage below target
It can be inferred that factors such as the introduction of rice paddy shifting cultivation, expansion of the area under shifting cultivation, field development, and progress in agricultural mechanization are involved in these changes compared to the time of the basic survey on land conservation.
(2) Fixed-point survey results from the Fukui Agricultural Experiment Station (conducted at five-year intervals since 1979)
The soil change from 1979 to 2008 shows dry rice paddies, decrease in pH, densification of the next surface layer, and soil fertility in terms of total nitrogen maintained at the current level.
...PK since the survey began (1979-2019)...
可給態リン酸-平成初めをピークに年々微減,令和の初めには調査地点の30%が10mgの下限未満
置換性加里-平成7年ごろをピークに年々微減,令和の初めには調査地点の80%が20mg未満
This decrease in PK can be attributed to a decrease in the type of material applied and the amount of material applied.
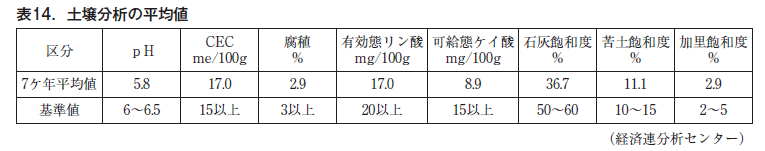
(3) Results of soil analysis by the Economic Federation (10,000 soil samples for 7 years from 2009)
Soil acidification and deficiencies of phosphoric and silicic acid were observed (Table 14). It is necessary to improve the nutrient status of the soil through steady soil cultivation and to continue to monitor the actual conditions.
10. 10. 50 years of paddy rice yields
本県の年ごとの米作りのスローガンをふりかえってみると
1969 - Producing the best rice in Japan in terms of yield
1975 - Soil building and 0123 Movement
昭和56年-日本一うまい米づくりコシヒカリ40%作付運動
1996 - Rebuilding Fukui Rice Upgrade Movement
2011 - Practice Mid-May Rice-Growing Campaign
平成28年-市場のニーズに応じた高品質な米づくり
令和5年-みんなの力が産地の評価・基本に忠実「美しい福井米」づくり
The slogan shows the trend of the times, from increasing rice production to pursuing good taste, and the attitude toward rice cultivation in each era in response to the high temperature environment and consumers.
The paddy rice yield in this prefecture used to be one of the highest in Japan in the 1965's with the "No. 1 rice production in Japan" campaign, but it has been lower than the national level since 1995 (Table 15).
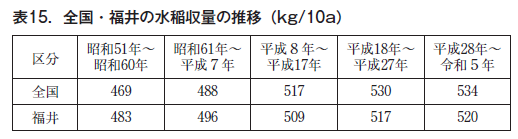
The rice yield was 500 kg/10a and the crop condition index was slightly poor at 98. Although the ratio of first-class rice ranked 7th in Japan (1st in Hokuriku) despite the extremely hot summer this year, the situation continues to be very severe for this prefecture, which is mainly engaged in rice production.
The recent brown rice protein content (JA Fukui Sakai farm weather test) is lower than that in the middle of the Heisei period (Table 16). The most likely reason for this is the influence of weather, since the amount of fertilizer applied is almost the same, but it is also necessary to consider the influence of soil fertility.
Once again, it is necessary to look at the soil, which is the foundation of production, and the environment surrounding it to make improvements. While the prefectural government and agricultural organizations are promoting the improvement of agricultural income and the expansion of rice exports, it is time for the engineers and people concerned in this prefecture to work together to clarify the factors behind the stagnation of paddy rice yields.
Conclusion
Half a century has passed since the first soil survey, and agriculture in this prefecture has changed drastically in various aspects, including land use, bearers, environment, production materials such as fertilizers, and agricultural machinery.
Against the backdrop of a decrease in the number of farmers, farmland accumulation has been progressing, and some advanced management organizations are now employing a large number of workers with business areas exceeding 100 ha. In the future, many organizations will be required to expand the scale and efficiency of their operations due to a further decrease in the number of farmers and an increase in the price of materials. On the other hand, it is no longer easy to obtain the high yield and quality of rice and soybeans as in the past due to the decrease in soil nutrients, soil fertility, and weather fluctuations.
In recent years, sulfur deficiency in paddy rice has been occurring in many parts of Japan. When I was a student, it was thought that although there were excess disorders, there was no deficiency in Japan, which is a volcanic region, and that air pollution caused by sulfur oxides from the combustion of fossil fuels was an environmental problem. Even in such an era, textbooks of the time pointed out the possibility of sulfur deficiency eventually occurring if factory exhaust and wastewater emissions were regulated and sulfuric acid-based fertilizers were reduced. As the textbooks pointed out, sulfur deficiency disease was feared to occur even in this prefecture half a century later. The points made in the textbooks of the time were rich in objectivity and foresight.
As mentioned at the outset, 2024 is the final year of the International Decade of Soils. The slogan is "Look to the soil, the silent comrade of mankind," but are we looking hard enough? The soil environment is steadily changing and slowly influencing the growth of crops. Our mission as engineers is to improve our technology with an objective viewpoint that does not overlook the slightest anomaly.
Now is the time for major changes to be made, and it is time for the prefecture's testing and research institutes, extension advisors, farm advisors, and sales representatives of materials to strengthen their studies and work together with producers to create a rice-producing region with hope for the future.
No Soil - No. 33
危機に瀕する世界の土-その3
塩類集積による土の劣化とそのリスク
前 ジェイカムアグリ株式会社
北海道支店 技術顧問
松中 照夫
In the previous issue, we discussed that soil degradation is progressing around the world and that the main causes are inappropriate human activities, especially over-cultivation, over-grazing, and over-logging. The main cause of soil degradation is the accumulation of salts (salinization) in the soil caused by inappropriate agricultural management.
1. soil degradation and salt accumulation
According to the Food and Agriculture Organization of the United Nations (FAO, 2021), in 2015, the world's agricultural land area (the sum of crop cultivated land (= all cultivated land) and permanently used grassland) was 4.76 billion ha, of which 34% was soil degraded due to human factors. Furthermore, the area of farmland has decreased by 110 million ha in the 15 years since 2000. On the other hand, the total cultivated land where crops are cultivated was 1.56 billion ha in 2015, an increase of 0.63 billion ha since 2000. Most of this increase, 0.49 billion ha, was in the area of land with irrigation facilities. As will be discussed below, this is an indication of the high productivity expectations of irrigated agriculture.
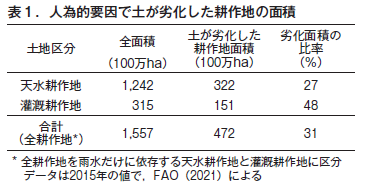
However, 470 million hectares, or 31% of the total cultivated land, has been degraded by human factors (Table 1). In particular, irrigated cropland accounts for 48%, or 150 million hectares. The largest cause of soil degradation in irrigated croplands is salt accumulation. It is estimated that 1.5 million hectares of irrigated cropland (about the same area as Iwate Prefecture) are abandoned due to salinization every year in the world.
2. two types of salt accumulation v
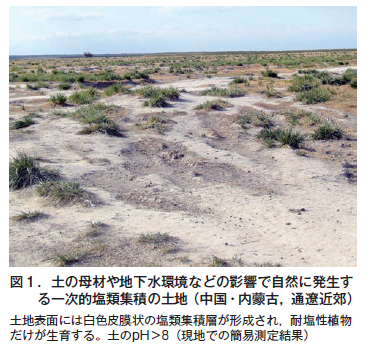
There are two types of salt accumulation in soil. One is salt accumulation that occurs naturally over a long period of time when the parent rock, which is the raw material of the soil, contains high concentrations of soluble salts, or when groundwater with high salt concentrations is present near the surface in arid regions. This is called primary salt accumulation. In this case, salts have naturally accumulated in the soil for a long time, and there is not much use of the land for agriculture. The other case we are considering here is salt accumulation caused by human factors such as inappropriate farmland management in irrigated agriculture, which is called secondary salt accumulation.
According to FAO (2015), the world's land area is 12.78 billion ha, of which 6.5% (830 million ha) is salinized. However, it is estimated that more than 90% of this area is degraded due to primary salt accumulation (Figure 1). From the perspective of agricultural land use, the problem is soil degradation caused by secondary salt accumulation.
3. highly productive irrigated cropland
Arid and semi-arid regions have little rainfall to begin with. Annual rainfall in the former is less than 200 mm, and in the latter, less than 800 mm in the summer rainy areas and less than 500 mm in the winter rainy areas. In other words, there are many sunny days in this region. With water and nutrients available, it is not surprising that crop productivity in this region is high, since crop photosynthesis is sufficiently enhanced. In fact, grain yields in irrigated croplands are about twice as high as those in rainfed croplands (FAO, 2011). Thus, although irrigated cropland accounts for only about 20% of the world's total cultivated land area (320 million ha in 2015, Table 1), it produces 40% of global cereal production (FAO, 2021).
4. soil salinization accelerated by coarse irrigated agriculture
However, once irrigated agriculture is started in arid and semi-arid regions, sustainable agriculture cannot be established without securing irrigation water in the future. This is because rainfall is scarce in these regions.
Even worse, these areas often have clay layers and other poorly permeable soil layers (impermeable layers) in the relatively shallow parts of the soil layers. When large amounts of irrigation water are poured into the soil with inadequate drainage channels, excess water stagnates in and around the farmland, causing water logging (waterlogging and overwatering) where the land is covered with water like a paddy field, or a temporary groundwater table is created in the soil. When soil is placed under such conditions, fine gaps (capillary pore spaces) in the soil connect the surface soil to the groundwater. When the excess water recedes and the topsoil appears, the water in the soil moves to the ground surface in this region where evaporation is very active. When water evaporates at the surface, dissolved nutrients and other salts remain in the surface layer of the soil and accumulate on the soil surface. Because there is little rainfall, the accumulated salts are washed away again and do not percolate into the soil. This accelerates the accumulation of salts in the soil.
Therefore, the introduction of rough irrigated agriculture in these arid and semi-arid regions without proper drainage channels leads to the tragedy of salinization of the soil. As already mentioned in this series of articles, this should have been learned by mankind from the history of the decline of ancient civilizations. However, that lesson has not been applied.
Concerns associated with competition for water resources
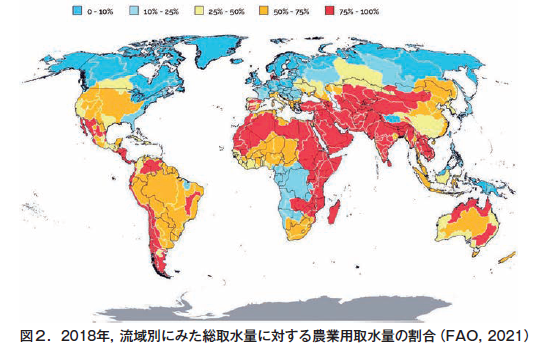
Water (freshwater) resources are used by many stakeholders, including industry and local residents as well as agriculture. The ratio of the total amount of freshwater withdrawn by all these parties to the total amount of renewable freshwater resources is called water stress. North Africa is in serious water scarcity with this ratio exceeding 100%, and the regions from Central Asia and the Middle East to Central Asia have water stress as high as 70-80% (FAO, AQUASTAT, 2021). In these regions, water withdrawals by the agricultural sector account for more than 75% of total water withdrawals, and irrigated agriculture itself contributes to increasing regional water deficits (Figure 2).
さらに,灌漑耕作地のおよそ40%は地下水に依存している(FAO,2011)。とくに水の補給がない地下帯水層での水分枯渇は深刻な懸念である。将来の水不足の時代に,農業と他部門との水資源の競合がさらに激しくなることも想定される。このため,灌漑耕作地への水供給の持続性には不安が大きい。灌漑農業の高い生産性は,世界の食料安全保障に大きな役割を果たしている。それだけに,灌漑農業の高い作物生産性を持続的に維持することの難しさは,未来の食料生産への不安でもある。