
Site Search
Search within product
No. 718 Published 2020 (R02) .02/03
Click here for PDF version
Agriculture and Science 2020/2/3

Japan Soil Inventory (e-Soil Map II)
Dissemination of soil information aimed at by
Research Center for Agricultural Environmental Change, National Institute of Agro-Environmental Sciences
Soil Resource Assessment Unit, Research Field of Environmental Information Infrastructure
Yusuke Takada
Introduction
Understanding the properties of soils, which are essential to the production of many crops, is very important for effective soil preparation and fertilizer management. The properties of soils, such as fertilizer retention, water retention, and drainage, are often affected by the base material and topography of the soil. For example, in plains where volcanic ash is deposited thickly, such as in the Kanto and Kyushu regions, black black soil is widely distributed.
This black soil has the property of strongly fixing phosphoric acid in the soil (phosphoric acid absorption coefficient of 1,500 or higher) and requires increased application of phosphoric acid for crop cultivation. In river flood plains, brown lowland soil, lowland paddy soil, gray lowland soil, and gley lowland soil are generally distributed from topographically higher to lower areas. When converting fields in areas where gray lowland soils (semi-wet fields) and gley lowland soils (wet fields) are distributed, it is especially important to implement drainage measures.
However, in brown lowland soils and lowland paddy soils, which are often found in drylands, drainage measures are less important, and conversely, in some cases, drought control measures are required. Even on the same topographic surface, the clay content and soil organic matter content tend to be higher in topographically depressed areas, and in such areas, the fertilizer and water holding capacity is also higher. Therefore, in order to promote appropriate soil preparation that takes into account the differences in soil properties, it is essential to use soil maps that show the distribution of each soil type at a glance.
2. development of soil inventory
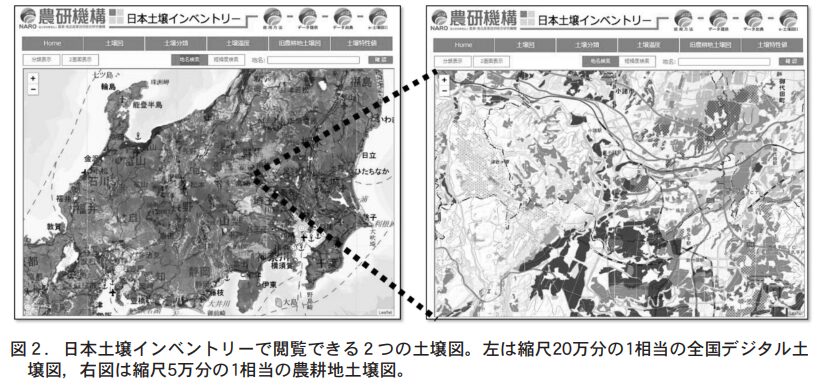
Soil classification is the classification of soils based on their different origins and properties. In 2011, the National Institute of Agrobiological Sciences (NIAS) developed the first draft of a comprehensive soil classification system, which divides domestic soils into 10 major soil types and 381 more detailed soil types. Using this soil classification system, we have created two types of digital soil maps at different scales. One is a digital soil map of the entire country at a scale equivalent to 1:200,000, which covers the entire land area.
The other soil map is a digital soil map of only agricultural land at a scale equivalent to 1:50,000, and is based on the soil map produced as a product of the Basic Survey for Land Conservation conducted by the Ministry of Agriculture, Forestry and Fisheries from 1959 to 1978. The scale of the soil map indicates the spatial density of the soil survey conducted to create the soil map, and the scale is 1:50,000.
indicates that surveys were conducted at intervals of one point per 25 ha.
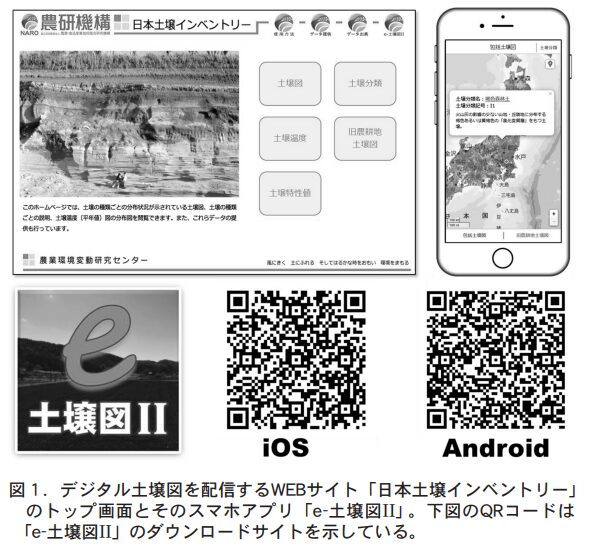
In April 2017, the National Institute of Agrobiological Sciences (NIAS) released the Japan Soil Inventory (https://soil-inventory.dc.affrc.go.jp/), which allows anyone to easily use digital soil maps and other soil information it has developed on the web. In April 2017, we also developed "e-Soil Map II," an application for smartphones (free of charge), so that digital soil maps can be used in the field as well (Figure 1). The word "inventory" in the above website name means "inventory of property," and since soil, which is the foundation of agricultural production, is an irreplaceable property, we used the word for managing that property in the website name.
3. soil information available in the Japan Soil Inventory
Soil information available in the Japan Soil Inventory is as follows
(1) Soil map covering the entire land area at a scale equivalent to 1:200,000 (also viewable on e-Soil Map II)
Soil map of agricultural land at a scale equivalent to 1:50,000 (also available on e-Soil Map II)
(iii) Soil temperature anomalies at 30-50 cm depth (1 km resolution)
4) Saturated hydraulic conductivity map and effective water capacity map showing soil permeability and water retention properties
The maximum water capacity (pF = 0), field water capacity (pF = 1.5), initial wilting point (pF = 2.7), and permanent
Soil moisture content map corresponding to each of the wilt points (pF value = 4.2)
6) Explanation of soil classification (also available on e-Soil Map II)
The Japan Soil Inventory provides digital soil maps as open data under the Creative Commons License (CCBY 4.0) with the copyright rule of Attribution 4.0 International Public, which allows modification and secondary use for commercial purposes under the condition that the original author's credit (National Agricultural Research Organization, Japan Soil Inventory) is indicated. The data is provided as open data that can be modified and secondary use for commercial purposes is permitted. The above digital soil map is also provided to the World Agricultural Data Relation Infrastructure (WAGRI), which is being developed in cooperation between the public and private sectors to promote the use of ICT in agriculture.
4. main functions of the Japan Soil Inventory and e-Soil Map II
(1) Soil map viewing function of the Japan Soil Inventory
The Soil Map Viewing Page of the Japan Soil Inventory is a webcast of digital soil maps projected on "GSI Tiles" provided by the Geospatial Information Authority of Japan (GSI). The map automatically switches to a soil map of agricultural lands when the map is enlarged (Fig. 2).
By clicking on a soil map, the name of the soil category distributed in that location is displayed, and the explanatory material containing the properties of the soil, a photograph of the soil cross section, and a distribution map can be viewed. Soil maps can also be searched by latitude, longitude, and address.
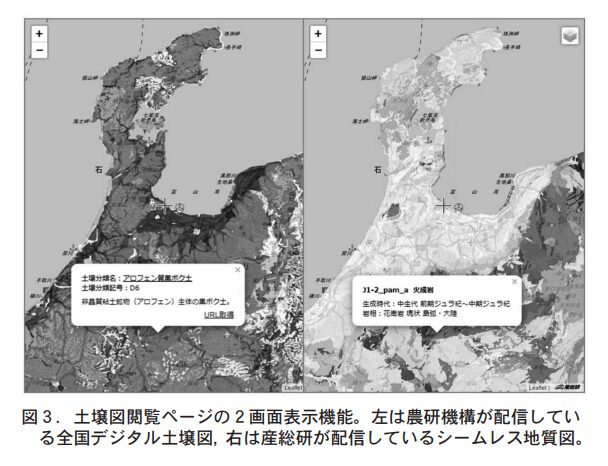
The soil map browsing page can be switched to a two-screen display, allowing users to view multiple aerial photographs taken at different times on the Geographical Survey Institute's Geographical Survey Map and the geological map published on the National Institute of Advanced Industrial Science and Technology's Seamless Geological Map V2 side by side with the soil map, enabling comparison of various information (Figure 3). The geological map can be viewed side by side with the soil map and compared with various information (Fig. 3).
The Soil Map Viewer page includes a classification display function that allows you to indicate the distribution of each soil taxon. As of November 2019, it is possible to refer to the Hokkaido Fertilizer Guide 2015, the Akita Rice Enhanced Taste Cultivation Manual (revised edition), and the Cultivation Standards for Common Crops (including Craft Crops) developed by Hokkaido, Akita, and Ibaraki Prefectures. The reference values for soil diagnosis and standard fertilizer application for each soil type are based on the "Hokkaido Fertilizer Guide 2015," "Akita Rice Taste Enhancement Cultivation Manual (Revised Edition)," and "Standard Crop Cultivation Standards (Including Craft Crops)" prepared by Akita and Ibaraki prefectures. In the future, we plan to link the standard fertilizer application rates prepared by each prefecture with the soil maps on a nationwide basis.
(2) Main functions of "e-Soil Map II
When the application is launched, a national map of loam equivalent to a scale of 1:200,000 is displayed, as shown in Figure 4 (left).
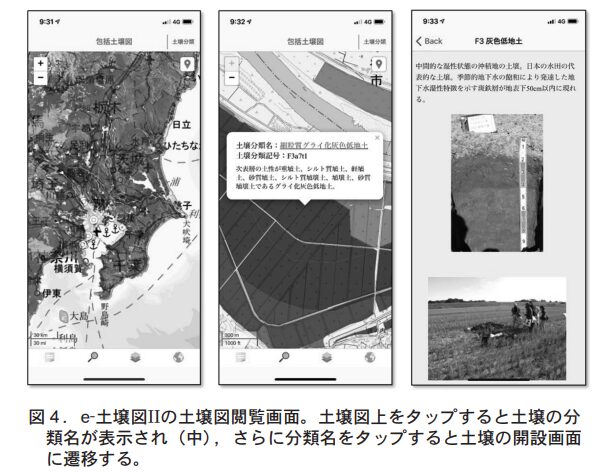
Pinching out" from the screen zooms in on the soil map, which automatically switches to the agricultural soil map (middle of Figure 4). Tap on the soil map to find out the name of the soil type distributed at that location (middle of Fig. 4), and tap on the name of the soil type to open the explanation page for that soil (right of Fig. 4). The application also allows users to easily search for a digital soil map using the user's location information from the mobile device's GPS.
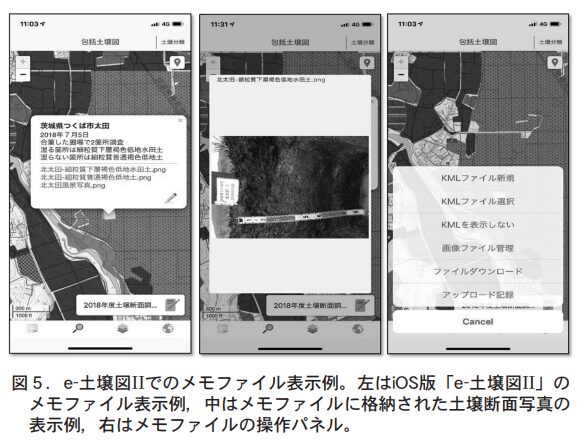
In e-Soil Map II, it is possible to display and edit field survey memos and photographs associated with soil maps, and to share and edit such memo information among users. Figure 5 shows an example of a memo file. In this memo file (left side of Fig. 5), the date and time of the soil cross-section survey, a photograph of the soil cross-section (middle of Fig. 5), the land management status of the field, the name of the soil classification, and the results of observations of the field and the soil cross-section are written in the memo field. This function allows users to place their own information on the soil map, making it possible to create a user-oriented soil map. This memo file can be shared among users via cloud storage provided by the National Institute of Agro-Environmental Sciences.
5. use of digital soil maps in agricultural production
(1) Refer to the Basic Guidelines for Geo-Enhancement
In 2008, the Ministry of Agriculture, Forestry and Fisheries (MAFF) revised the Basic Guidelines for Soil fertility Enhancement, which provide basic soil management methods and promotion of appropriate soil management for soil development, basic improvement targets and basic improvement measures for soil properties, and other important matters related to soil fertility enhancement. Among them, the "basic improvement target of soil properties" defines target values for improvement of soil properties (pH, effective phosphate, etc.) for each major soil type. Therefore, it is possible to refer to the basic improvement target values of soil properties indicated in the basic guideline for soil fertility improvement by using the Japanese Soil Inventory and e-Soil Map II to check the soil type.
In addition, the Basic Guidelines for Soil fertility Enhancement promotes soil fertility through the conversion and utilization of organic resources such as livestock manure as "Important Matters for Soil fertility Enhancement. Therefore, the guideline provides standard values for the application of compost for each soil type (black-box soil or not), normal soil temperature (30 to 50 cm below the soil surface), and cultivated crop (rice, field crops, vegetables, and fruit trees). Using the two-screen display function of the Japanese Soil Inventory, it is possible to simultaneously examine soil type and soil temperature at any location, and to refer to the standard values for fertilizer application in soil preparation.
(2) Confirmation of soil characteristics of candidate farmland for lease
One of the growing applications of digital soil maps is to confirm the soil properties of candidate farmland for lease. The soil properties that are of concern when leasing farmland can be determined by looking at the soil map, such as whether the soil distributed on the candidate farmland has the same properties as the farmland that has been managed so far, whether the soil is suitable for the crop to be planted, and whether the farmland has good drainage and water retention properties.
For example, if the potential leased land has the same soil type distribution as the currently managed farmland, it is more likely that similar cultivation methods can be applied. For example, "fine/medium coarse-grained" in the soil name indicates the amount of clay in the soil, and fine-grained soils are generally more fertile because of the amount of clay, while coarse-grained soils are more sandy and less fertile. In addition, the soil types named "gley" such as gley lowland soil, stagnant water gley soil, and gley black box soil have an oxygen-deficient soil layer within 50 cm below the surface, making drainage measures important for the cultivation of field crops. In addition, peat soils and "peaty" gley soils with the word "peat" in the soil type name indicate that there is a soil layer made of peat (plant remains) in the soil section, which is generally poorly drained and has poor soil fertility and drainage.
The land is prone to land subsidence due to the
In addition, soil with the name "black box soil" in the soil type name has a property that makes it difficult for phosphate fertilizers to be effective, so it is necessary to check the amount of phosphate that can be absorbed by crops through soil diagnosis. Thus, knowing the name of the soil type is very important information for the "soil preparation" of the leased farmland.
6. dissemination of soil information aimed at by the Japan Soil Inventory (e-Soil Map II)
Finally, the following are the three main goals of the Japan Soil Inventory for the future dissemination of soil information.
Reliability and sustainabilityThe following is a brief summary of the soil inventory and its information distribution.
2) ImmediacyThe immediacy of the information, such as soil temperature and soil moisture, will be enhanced by transmitting predictions of daily changes.
(iii) DiversityWe will continue to develop applications to meet diverse soil information needs and promote the diversification of soil information. Specifically, we are developing: i) a function to display daily changes in estimated values of soil temperature and moisture (30-year average); ii) a function to visualize the accumulation (decrease) of soil organic matter based on the amount of organic matter input such as compost; and iii) a function to visualize the fertilizer efficacy of compost and the possible amount of chemical fertilizer reduction.
Fertilizer with regulated fertilizer efficacy in three major soils in Okinawa Prefecture.
Labor-saving fertilizer application for spring planting of okra using
Nago Branch, Agricultural Research Center, Agriculture, Forestry and Fisheries Department, Okinawa Prefecture
主任研究員 田 中 洋 貴
Introduction
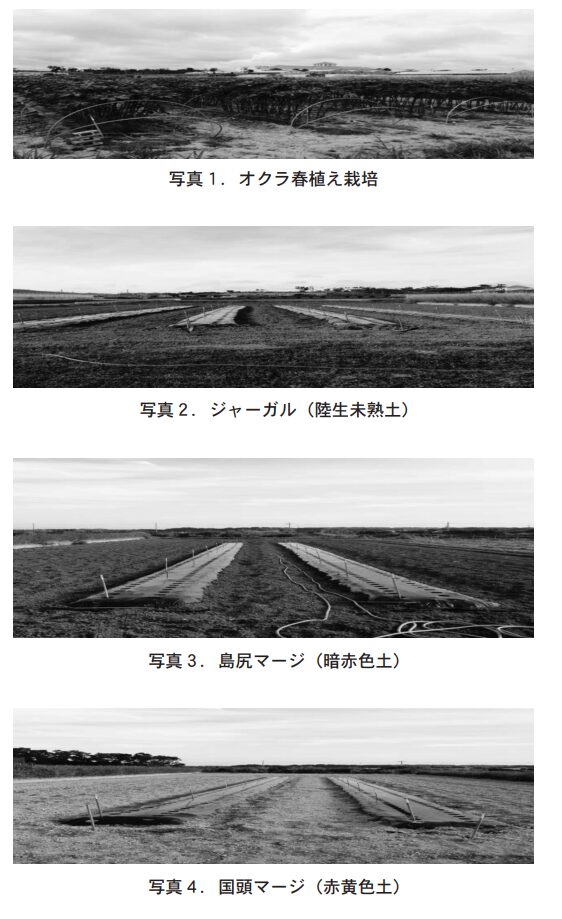
Okinawa Prefecture's okra shipments are the third largest in Japan, and it is grown throughout the prefecture as a specialty vegetable. Okra cultivation requires a large number of fertilizer applications, and there are calls for the development of fertilizer with regulated fertilizer efficacy and the establishment of fertilizer application standards in order to save labor at production sites. In addition, okra cultivation in Okinawa Prefecture is carried out on three soils with very different characteristics, namely Jargal, Shimajiri Merge, and Kunigami Merge, and the appropriate amount of fertilizer for each soil may differ.
In order to develop and promote the use of fertilizer with regulated fertilizer in spring planting of okra, we conducted a two-year trial of fertilizer with regulated fertilizer on three soils to determine the appropriate amount of fertilizer to be applied to enable labor-saving fertilization.
2. Outline of the test
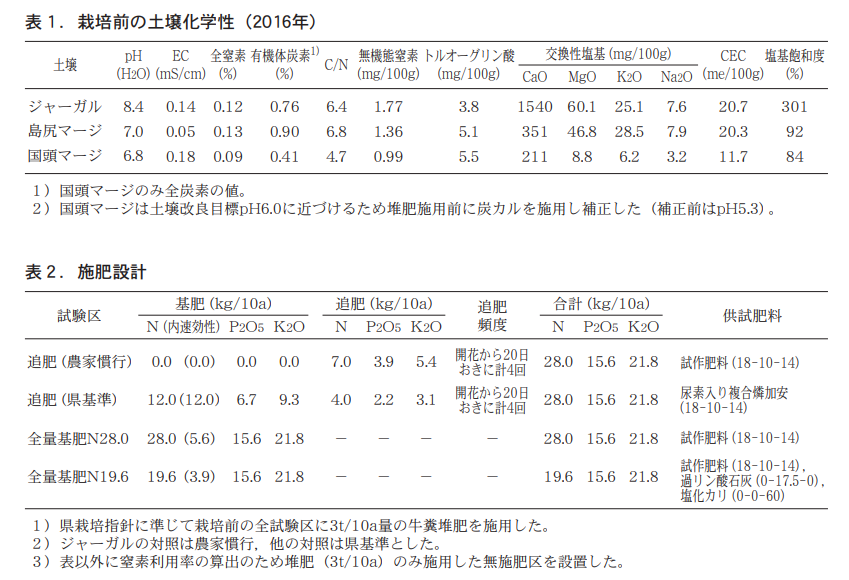
The cultivation system was spring planting (sowing in late March, flowering in late May, and harvesting in late August) in three plots: Jargal (terrestrial immature soil), Shimajiri Merge (dark red soil), and Kunigami Merge (red-yellow soil). The variety "Blue Sky" was tested, planted in two rows of three plants per hole, with 25 cm between plants, 40 cm between rows, and 150 cm wide ridges, and covered with black mulch. The chemical properties of the test soils are shown in Table 1 (data for 2015 are omitted). The fertilizer design was as shown in Table 2, with a total basal fertilizer system using the trial fertilizer (18-10-14, N slow efficiency 80%, LPS80:LPS140=35:65) and the conventional "Combined phosphorus-added fertilizer No. 804 with urea (18 -The growth, yield, and apparent
Comparison of the nitrogen balance and other parameters of the
In this study, we examined whether or not the total basal application of the prototype fertilizer was excessive or insufficient in terms of fast-acting nitrogen for initial yield and slow-acting nitrogen for mid- to late-season yield in relation to the conventional fertilizer system in each soil, and clarified the appropriate amount of the prototype fertilizer to be applied.
Results and Discussion
(1) Jargal.
Jargal has the most fertile soil in the prefecture, located in the southern part of the main island, and is a major producer of many horticultural products, including okra. In the production site, many growers are concerned about overgrowth of okra, which may lead to poor fruit set, so they do not apply base fertilizer, but use supplementary fertilizer instead, which differs from the prefectural fertilization standard. This prototype fertilizer was designed to be used mainly in jargal cultivation, with a low amount of fast-acting nitrogen as a base fertilizer (about half of the prefectural fertilizer standard).
The two levels of nitrogen application with total basal fertilizer did not show significant overgrowth in the early stage and no reduction in initial yield (total marketable fruit yield in May and June) due to flower drop, suggesting that the amount of fast-acting nitrogen as basal fertilizer (3.9-5.6 kg/10a, calculated from 80% with nitrogen slow efficiency) is appropriate (Table 3). Table 3). Next, regarding the nitrogen leaching of the two LP coats as substitutes for fertilizer, LPS80 became higher around late May, which was the flowering period, and LPS140 became higher around mid-June, after flowering (Figure 1).
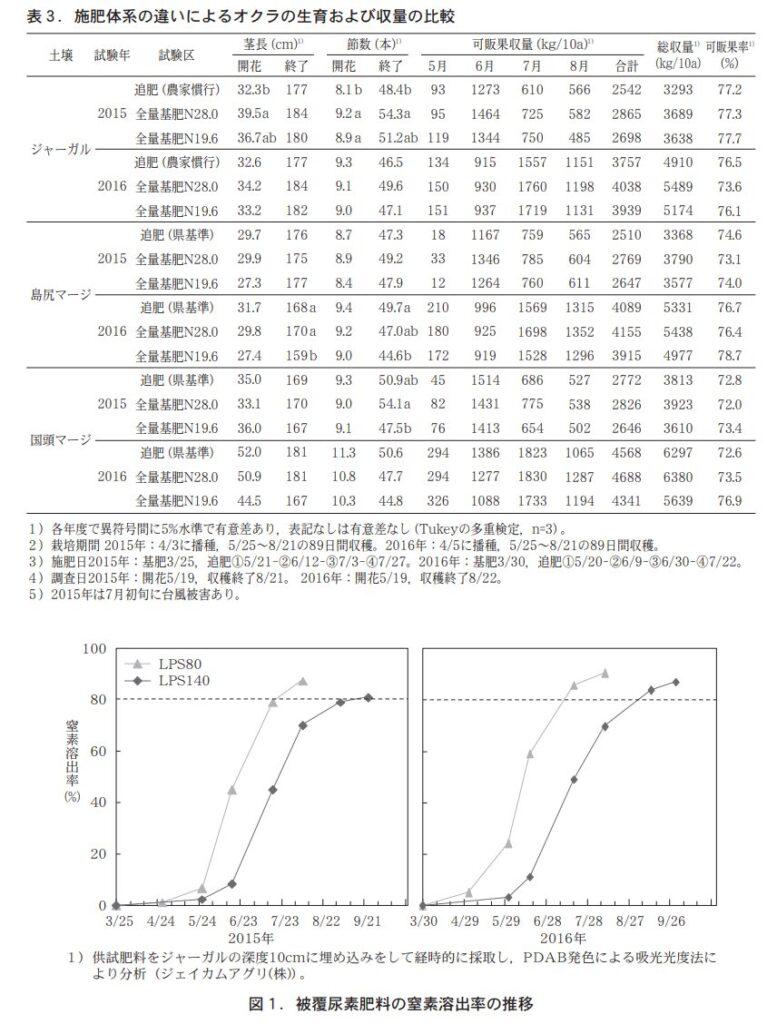
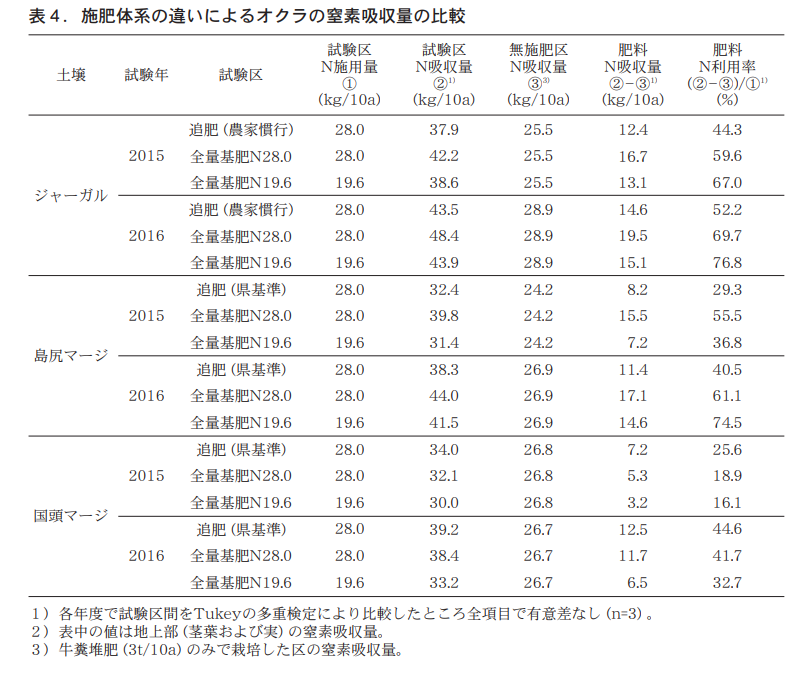
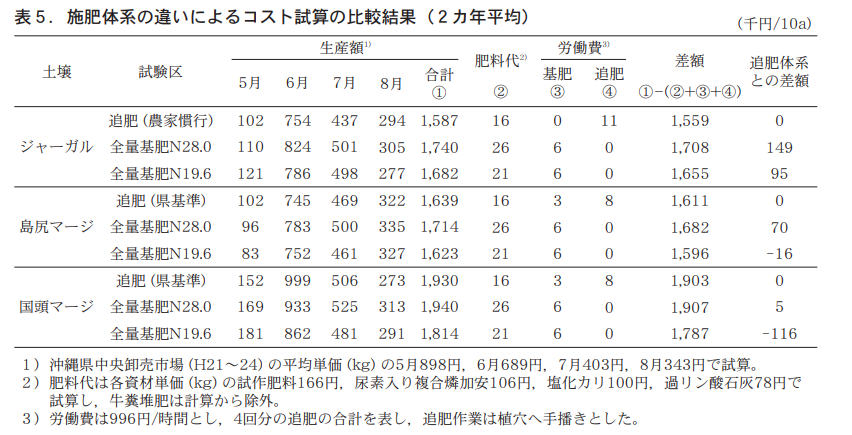
The nitrogen leaching rate of 80%, which is an indication of fertilizer efficacy, was in mid-July with LPS80 and in early September with LPS140, thus maintaining nitrogen supply during the harvest period in spring-planting cultivation (Figure 1). Next, nitrogen uptake was highest when 28.0 kg of nitrogen/10 a of total basal fertilizer was applied, and was almost equal to that of the additional fertilizer system when 19.6 kg of nitrogen/10 a was applied (Table 4). The same was true for the total saleable fruit yield (Table 3). In the final cost estimation results, the difference between the two nitrogen application levels of total basal fertilizer and the fertilizer application system was positively evaluated (Table 5).
3) Kunigami Merge
The Kunigashira merge is the least productive soil in the prefecture, located in the northern part of the main island, and as with the Shimajiri merge, most okra production sites apply basal fertilizer according to the prefectural fertilizer standard. Both the two levels of nitrogen application of total base fertilizer tended to decrease initial growth and yield (total yield in May and June) compared to the fertilizer system (Table 3). This suggests that 3.9 to 5.6 kg/10a of fast-acting nitrogen in the prototype fertilizer may be insufficient. However, the application of 28.0 kg nitrogen/10 a of total basal fertilizer tended to increase mid- and late-season yields (June-July) compared to the fertilizer system, and total producible fruit yield was similar or higher, although nitrogen absorption was slightly lower (Tables 3 and 4).
On the other hand, the application of 19.6 kg nitrogen/10 a of total basal fertilizer resulted in a decrease in nitrogen absorption and total saleable fruit yield compared to the additional fertilizer system (Tables 3 and 4). In the final cost estimation results, the 28.0 kg/10 a of total base nitrogen fertilizer application was evaluated positively, while the 19.6 kg/10 a of nitrogen application was evaluated negatively (Table 5). Compared with the fertilizer system, the 19.6 kg/10a nitrogen application resulted in a 2-year average total saleable fruit yield of 3493 kg/10a and 3670 kg/10a, respectively, a decrease of about 51 TP3T, but a significant difference of 116,000 yen compared with the fertilizer system. This is because the unit price of okra (yen/kg) was 898 yen in May, 689 yen in June, 403 yen in July, and 343 yen in August (monthly average from H21 to H24 at the central wholesale market in Okinawa Prefecture) , and the unit price of okra was
The results reflected the large differences in initial yields (Tables 3 and 5).
Summary
These results suggest that the trial fertilizer can be applied at the standard nitrogen level (28.0 Nkg/10a) and 70% (19.6 Nkg/10a) in Jargal's spring-planted okra cultivation to save labor while maintaining yield. In the Shimajiri and Kunigami merges, labor saving in fertilizer application was possible by applying the standard amount of nitrogen.
The prototype fertilizer was designed with a low base fertilizer because its main purpose was to be used in Jargal, but it became clear that it could be used in soils with different properties by adjusting the amount of nitrogen applied. However, at the Kunigami Margin, yields were lower in May and June, when unit prices are high, at the standard and 70% application rates of the prototype fertilizer, so there is room to reconsider the use of fast-acting nitrogen in the formulation. In the future, we would like to conduct field trials of the prototype fertilizer and continue to improve it with the aim of promoting its widespread use.