
Site Search
Search within product
第748号 2023(R05).02-03発行
Click here for PDF version
§水田土壌の粘土含有量と炭素含有量から根こぶ病防除に必要な転炉スラグおよび消石灰の施用量を計算する方法
Tohoku Agricultural Research Center
Field Crops and Horticulture Research Area New Vegetable Production Group
山口 千仁
No § Soil - No. 19
吸収された窒素がタンパク質になるまで
-植物は必要なアミノ酸をすべて自給する-
Jcam Agri Co.
北海道支店 技術顧問
松中 照夫
水田土壌の粘土含有量と炭素含有量から
根こぶ病防除に必要な転炉スラグおよび消石灰の
施用量を計算する方法
Tohoku Agricultural Research Center
Field Crops and Horticulture Research Area New Vegetable Production Group
山口 千仁
Introduction
主食用米の需要は長期的に減少しており,東北地域では水田営農へ加工・業務用キャベツなどを含む野菜作を導入することが望まれる。一方で,水田転換畑に野菜作を導入する際に土壌病害が多発することが問題となっている。例えば,難防除性の土壌病害であるアブラナ科根こぶ病は多湿条件下で発病しやすいため1),排水不良から多湿になりやすい水田転換畑においては特に対策をする必要がある。
Since the activity of filamentous fungi such as root-knot fungi is suppressed when soil pH is high (alkaline), it is recommended that soil pH be raised to about 7.5 for the control of Brassica root-knot disease. To adjust soil pH, converter slag or slaked lime is used as an alkaline material. Converter slag is a byproduct of the steelmaking process and is an eco-friendly alkaline material made from industrial waste. Because alkaline soils tend to cause micronutrient deficiencies in plants, converter slag, an alkaline material containing micronutrients, is used.
根こぶ病防除を目的として土壌pHを矯正する場合,土壌pHを7.5にするために必要なアルカリ資材の量を知る必要がある。しかし,土壌は各々緩衝能が異なり,アルカリ資材の施用に応じたpH上昇程度の予測は困難である。そのため,今までは各畑の土壌を用いて土壌pH緩衝曲線を描き,施用するアルカリ資材の量を推定していた2)。一方で,土壌pH緩衝曲線の作成には振とう機やpHメーターなどの器具が必要で手間もかかる。そこで本報告では,現場での使用を想定し,野外判定やWeb情報から抽出可能なパラメータ(土壌の粘土含有量と全炭素含有量)を用いて転炉スラグや消石灰の施用量を決定する式3)を提案する。
2. addition of alkaline materials to test soil and measurement of soil pH
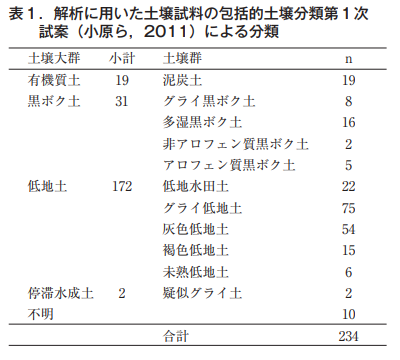
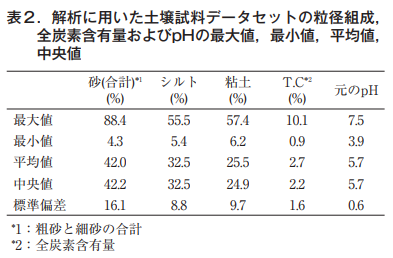
東日本および北海道の各地でサンプリングされた,粒径組成が明らかである水田土壌(作土)234点4)を供試した。解析に用いた土壌試料の包括的土壌分類第一次試案5)による分類を表1に示す。試土壌の粒径組成(ISSS法),全炭素含有量および元のpHの最大値,最小値,平均値,中央値および標準偏差を表2に示す。土壌の粒径組成はピペット法により測定された4)。土壌の全炭素含有量は土壌のサンプリングを行った各県担当者より提供いただいた。土壌試料は風乾状態で2mmのふるいを通した後,pH緩衝曲線の作成に用いた。
pH緩衝曲線の作成には,アルカリ資材として転炉スラグ(粒状,くみあい転炉副産石灰2号,ミネックス株式会社)または消石灰(粉状,70防散消石灰,東亜産業株式会社)を用いた。転炉スラグおよび消石灰のアルカリ分(0.5mol L-1塩酸可溶性カルシウムとマグネシウムを酸化カルシウムに換算した量の合計)はそれぞれ50%,70%であった。乾土10gあたりに対し転炉スラグまたは消石灰をアルカリ分換算量で0.025,0.05,0.25,0.5,1.0g添加し,よく混合した。その後,蒸留水25mL(乾土1に対し蒸留水2.5)を加え,1時間振とう後1時間静置し,pH(H2O)をガラス電極法によって測定した6)The following is a list of the most common problems with the "C" in the "C" column.
3. mathematical formulation of soil pH buffer curve
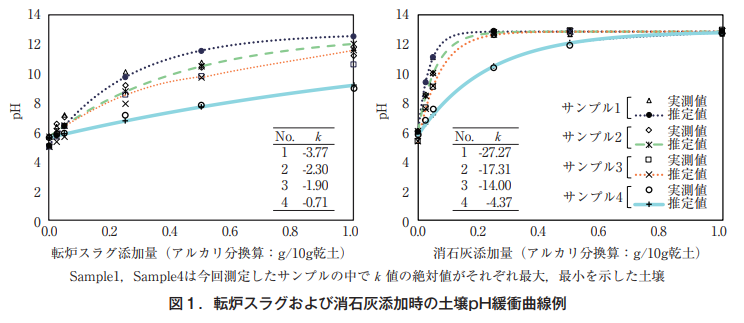
土壌pH緩衝曲線の数式化は,Luo et al.(2015)6)の方法に従った。アルカリ資材をアルカリ分換算で x(g/10g乾土)添加した場合のpHは,(1)の式で表される。
pH=pHmax-pHintexp (kx) ……(1)
pHmax is the maximum value for each material, and pHmax-pHint is the soil pH without the material (original pH in Table 2). k is a constant related to the amount of alkaline material added. The maximum value of pHmax was defined as the pH when 1.0 g of converter slag or slaked lime in terms of alkali content was added to 25 mL of distilled water. The pHmax of converter slag = 12.73 and that of slaked lime = 12.89. Equation (1) was fitted to the data by finding the value of k using the method of least squares, which minimizes the sum of the squares of the difference between the measured value and the value obtained from the equation. Equation (1) shows that when the amount of alkali material applied is 0 g, the test soil shows the original pH. As the alkali input approaches infinity, the pH buffering capacity of the soil becomes negligible and approaches the pH of the soil when the alkali material is added to water (pHmax).
Figure 1 shows examples of pH buffer curves for four soils, including those with the largest and smallest k values among the samples used in this study. k value is an index of the pH buffering capacity of a soil, and the slope of the pH buffer curve increases with the absolute value of k. The slope of the pH buffer curve varies with the soil and each alkaline material. The slope of the pH buffer curve was different for different soils and different alkaline materials, but it could be calculated by changing the k value and pHmax, respectively, using Equation (1).
4. index k of soil pH buffering capacity expressed in terms of soil clay content and carbon content
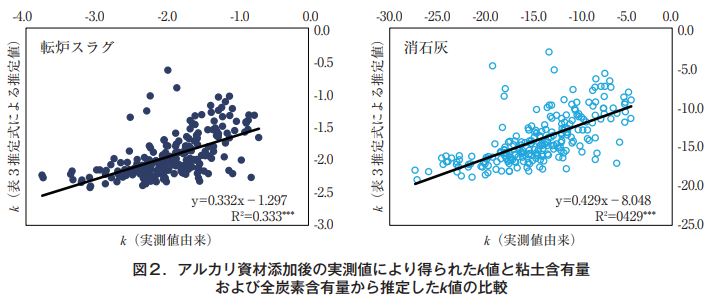
土壌のpH緩衝能は陽イオン交換容量(CEC)と強い相関を示すことが報告されてきた7, 8, 9)。CECは炭素含有量や粘土含有量に大きく影響を受ける10, 11)。そこで,転炉スラグ,消石灰それぞれを添加した場合に式(1)から求められるk値を目的変数,土壌中の粘土含有量と全炭素含有量を説明変数とした重回帰分析を行った(表3)。粘土含有量および全炭素含有量の両方を説明変数とした式により推定されるk 値と,実測由来 k 値とから得られた単回帰式の決定係数は転炉スラグで0.333(自由度調整済み決定係数:0.327),消石灰で0.429(自由度調整済み決定係数:0.424)であり(図2),k の分散の約3~4割を土壌中の粘土含有量および全炭素含有量が説明する結果となった。
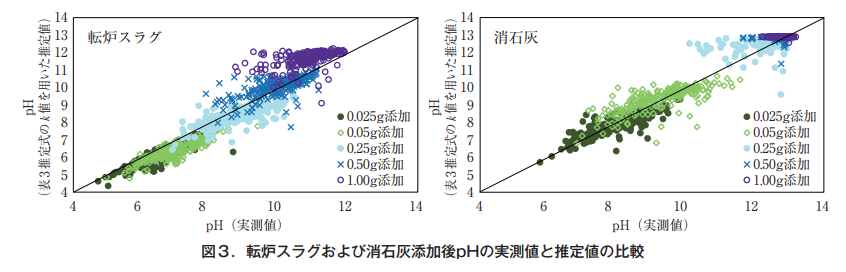
Comparison of measured pH values after addition of converter slag and slaked lime with values estimated from clay content and total carbon content
For each soil sample, k was calculated using the equation in Table 3, and the obtained k value was substituted into Equation (1) to estimate pH. The measured values on the horizontal axis and the estimated values using Equation (1) on the vertical axis for the cases where 0.025, 0.05, 0.25, 0.5, and 1.0 g of converter slag and slaked lime were added in terms of alkali content were plotted, and the estimated soil pH values agreed well with the measured values up to the slightly alkaline range (Figure 3).
Based on the above, the following estimation equation is recommended for estimating the amount of alkali material applied to correct soil pH in the range up to weak alkalinity.
転炉スラグ:
pH=12.73-pHintexp {(0.0140×粘土 (%)+0.1437×全炭素含有量 (%)-2.686) x (g/10g乾土)}
消石灰:
pH=12.89-pHintexp {(0.1833×粘土 (%)+1.0729×全炭素含有量 (%)-21.668) x (g/10g乾土)}
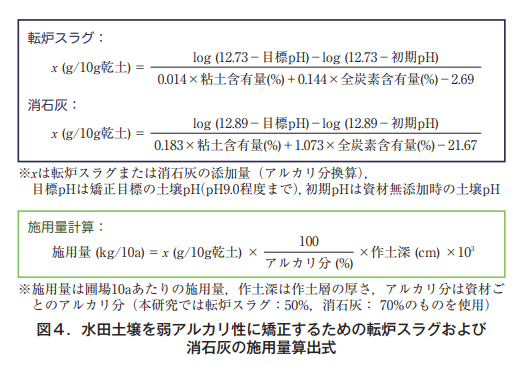
6. a simple method for calculating the amount of alkali material to be applied
推定数式を変換した図4の式は,土壌を目標pHに矯正するために必要な転炉スラグおよび消石灰の施用量を算出する計算式である。この式には,土壌情報として初期pH,粘土含有量,全炭素含有量を用いる。土壌の粘土含有量と全炭素含有量をそれぞれ触感と色調で判別し,土壌の初期pH(アルカリ資材無添加時の土壌pH)をポータブルのpH計を用いて測定することで,簡易的におおまかな施用量を算出することができる。また,今後,e-土壌図Ⅱのようなデジタル土壌図12)から対象地の土壌の粘土含有量と全炭素含有量を把握できるようになる可能性があり,土壌図のデータを活用してアルカリ資材投入量を決定する際に,本推定方法が有効になると考えている。
7. Precautions in applying this method
The recommended soil pH for the purpose of soil disease control varies among municipalities. The grain size of converter slag varies by product and lot, and the difference in solubility of the material caused by the difference in grain size greatly affects the pH buffer curve. In addition, soil pH varies depending on the moisture content of the soil after application, etc. Therefore, the calculated amount of alkali material to be applied is a theoretical value and can only be used as a rough guide.
Acknowledgements
We would like to thank the agricultural research institutes in each prefecture that provided soil samples and analytical data for this study, as well as the Tohoku Agricultural Research Center of the National Agricultural Research Organization (NARO) for their cooperation in conducting this study.
References
1)後藤逸男・村上圭一 2006.
おもしろ生態とかしこい防ぎ方 根こぶ病 土壌病害から見直す土づくり.
p.44-56,農文協,東京.
2)村上圭一・後藤逸男 2008.
アブラナ科野菜根こぶ病防除のための転炉スラグ施用量簡易決定法.
関西病虫害研究会報,50,p.97-98.
3)山口千仁,高橋智紀,加藤邦彦,新良力也2021.
水田土壌を弱アルカリ性に矯正するための転炉スラグおよび
消石灰添加量を粘土含有量と炭素含有量に基づいて推定する方法.
土肥誌,92,p.174-181.
(4) Takahashi, T., Nakano, K., Nira, R., Kumagai,E., Nishida, M. and Namikawa, M. 2020.
Conversion of soil particle size distribution and texture classification from ISSS system to FAO/USDA system in Japanese paddy soils. Soil Sci. Plant Nutr., 66, 407-414.
5)小原 洋,大倉利明,高田裕介,神山和則,前島勇治,浜崎忠雄,2011.
包括的土壌分類第1次試案,
農業環境技術研究所資料,第29号1-73.
6)土壌環境分析法編集委員会編 1997.
土壌環境分析法,p.195-197.博友社,東京.
7)Luo, W.T., Nelson, P.N., Li, M.-H., Cai, J.P., Zhang, Y.Y., Zhang, Y.G., Yang, S., Wang, R.Z., Wang, Z.W., Wu, Y.N., Han, X.G. and Jiang, Y. 2015.
Contrasting pH buffering patterns in neutral-alkaline soils along a 3600km transect in northern China, Biogeosciences, 12, 7047-7056.
8)Aitken, R. L. 1992
Relationships between extractable Al, selected soil properties. pH buffer capacity and lime requirement in some acidic Queensland soils, Austr. J. Soil Res., 30, 119-130.
(9) Xu, R., Zhao, A., Yuan, J., and Jiang, J. 2012.
pH buffering capacity of acid soils from tropical and subtropical regions of China as influenced by incorporation of crop straw biochars. J. Soil. Sediment., 12, 494-502.
10)船引真吾 1972.
新編土壌学講義.p.44-56,養賢堂,東京.
11)白水晴雄 1988.
粘土鉱物学-粘土科学の基礎-.p.38-42,朝倉書店,東京.
12)高田裕介 2018.
日本土壌インベントリーの開発と利用(特集 農業環境情報の最新利用技術),
農林水産技術,6,7-12.
(https://soil-inventory.dc.affrc.go.jp/index.html)
No Soil - Part 19
吸収された窒素がタンパク質になるまで
-植物は必要なアミノ酸をすべて自給する-
Jcam Agri Co.
北海道支店 技術顧問
松中 照夫
Plants select and absorb only the nutrients they need from the water in the soil (soil solution) by a well-developed mechanism. The absorbed nutrient ions support the nutrition of the plant by either becoming components of substances that help to nourish the plant or by participating in various reactions in the plant body.
This month, as an example, we will look at how plants use nitrogenous nutrient ions such as ammonium and nitrate ions and carbohydrates produced by photosynthesis in leaves to make proteins.
1. how amino acids are synthesized from ammonium ions
アンモニウムイオン(NH4⁺)の窒素(N)や水素(H)は,タンパク質の構成成分で植物の重要な養分である。しかし,アンモニウムイオンが多量に植物の地上部に送り込まれると光合成を妨害するなど,植物に悪影響を与える。このため,多くのアンモニウムイオンは根の細胞内にとりこまれると,すぐにアミノ酸に合成されて無毒化される。その経路を示したのが図1である。
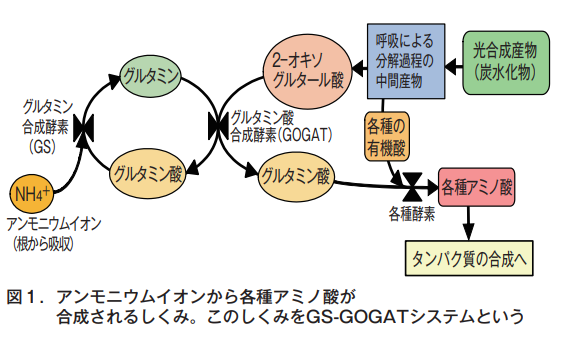
Ammonium ions taken up by plant root cells are first combined with an amino acid called glutamic acid to form an amino acid called glutamine. This reaction is the function of glutamine synthetase. This glutamine is converted into two glutamic acids by reacting with 2-oxoglutaric acid, an organic acid that is an intermediate product of the breakdown of carbohydrates produced by photosynthesis through plant respiration. This reaction is the function of glutamate synthase.
Of the two glutamic acids, one is again combined with ammonium ions to make glutamine. The other reacts with various organic acids, which are intermediate products of the breakdown of photosynthetic products by plant respiration, to produce the necessary amino acids. In this case, the reactions are also carried out by enzymes that assist in each reaction. In this way, all necessary amino acids are self-sufficient, and proteins are synthesized from them.
2. how amino acids are synthesized from nitrate ions
アンモニウムイオンは図1の経路でアミノ酸合成がおこなわれる。ところが,アンモニウムイオンは,畑のように空気中の酸素に触れやすい条件(酸化条件)では,土の微生物の働きで硝酸イオンに変化する。これが硝酸化成作用である。したがって畑作物などが吸収する養分としての窒素の形態は硝酸イオンが主体である。この場合,どのようにしてアミノ酸が合成され,タンパク質の材料となるのだろうか。ここでも植物はたくみなしくみを用意している。
植物に吸収された硝酸イオンがアミノ酸の原料となるには,硝酸イオンがアンモニウムイオンに変化し,図1のアンモニウムイオンからアミノ酸合成されるしくみ(GS-GOGATシステムという)に組み込まれていく必要がある。その働きをおこなうのが硝酸還元酵素と亜硝酸還元酵素である(図2)。いずれも酵素反応で,協同して硝酸イオンをアンモニウムイオンへ変化させる。
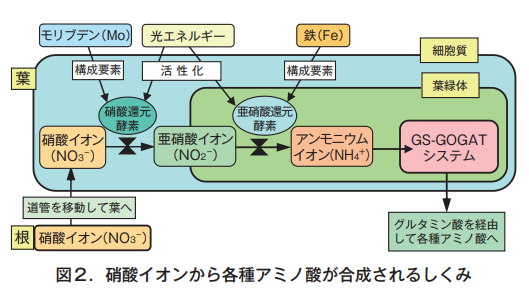
Many nitrate ions are absorbed by the roots and then translocated in their intact form through the ducts to the leaves. This is because leaves are well exposed to sunlight and can easily obtain the light energy necessary for this enzymatic reaction. The nitrate ions transferred to the leaves are converted to nitrite ions by the action of nitrate reductase. Nitrite ions are further converted to ammonium ions by nitrite reductase. The nitrite ion then enters the GS-GOGAT system, an amino acid synthesis pathway (Fig. 2), and the necessary amino acid synthesis is carried out.
3. mechanism to prevent excessive accumulation of ammonium ions
ここで問題となるのは,硝酸イオンからアンモニウムイオンに変化させる酵素反応の速度と,できたアンモニウムイオンがアミノ酸合成のGS-GOGATシステムに取り込まれていく速度の関係である。もし前者の速度が後者の速度を上回ると,この酵素反応でできたアンモニウムイオンが葉に蓄積してしまう。しかし,これは避けなければならない。アンモニウムイオンの蓄積は植物に悪影響を与えるからである。そうならないように,硝酸還元酵素はアンモニウムイオンを蓄積させない機能を持っている。
硝酸還元酵素は硝酸イオンが吸収されることで酵素反応を活性化させ,亜硝酸イオンをつくる。しかし,この亜硝酸イオンが亜硝酸還元酵素の働きでアンモニウムイオンになると,それがアミノ酸合成に組み入れられて細胞内で無毒化されるまで,硝酸還元酵素は自身の酵素活性を抑制する。つまり,硝酸還元酵素はむやみにアンモニウムイオンをつくらないように酵素活性を自己規制している。これによって,硝酸イオンがアンモニウムイオンに変換される速度と,酵素反応でできたアンモニウムイオンがアミノ酸へ変換される速度との間でバランスが維持されている。この硝酸還元酵素のように,状況に応じて目的にかなうように反応活性の調節機能を持つ酵素を適応酵素あるいは誘導酵素という。
The fact that nitrate reductase is an adaptive enzyme is especially important for many plants that mainly absorb nitrate as a nitrogen nutrient source, in order to avoid the danger of excessive accumulation of ammonium ions.
4. the only external raw material required for amino acid synthesis is ammonium ions
From what we have seen so far about the mechanism of amino acid synthesis, we can notice something. The only raw material that plants need to acquire from outside in order to synthesize amino acids is ammonium ions. The other raw material, photosynthetic products (carbohydrates), is synthesized by the plant itself. This is made possible by two enzymes that synthesize glutamine and glutamic acid. It is thanks to the action of these two enzymes that plants are able to synthesize complex amino acids from simple substances such as ammonium ions.
5. plants do not contain essential amino acids
We are not self-sufficient in all the amino acids needed for protein synthesis. Therefore, we need to acquire the necessary amino acids from the food we eat. These are the essential amino acids. Plants do not have essential amino acids because they are self-sufficient in all the amino acids necessary for protein synthesis. We should avoid the misconception that plants have substances like the essential amino acids of animals.